What is the lowest percentage of a team's score achieved by the top scorer in a Test?
And how many batters have had the same score in a Test, or bowlers the same analyses? Deep diving into stats to unearth quirky numbers
Anantha Narayanan
10-Feb-2024
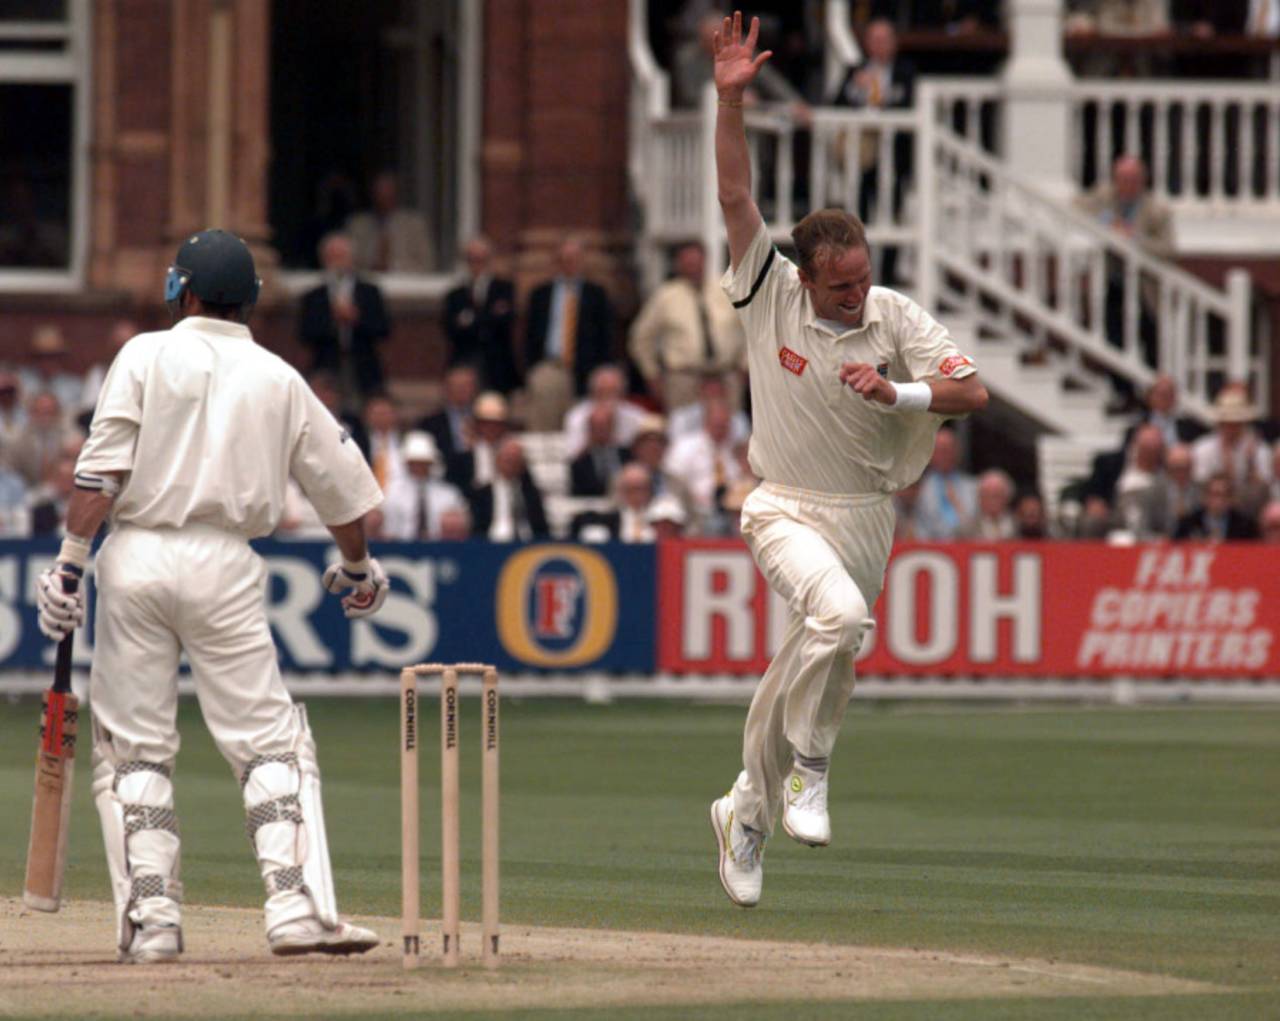
Nasser Hussain's (left) 15 was 13.6% of England's first-innings score of 110 - the smallest percentage of a team's total by its highest scorer in the innings • Getty Images
What are the questions I normally ask or get asked about Test cricket?
Which batter has scored the greatest number of fours in an innings?
Which team has achieved the biggest win by runs?
Which fielder has taken the most catches in a match?
Who has played the best innings in a losing cause based on Rating points?
Which bowler has conceded the most runs in his spell?
Which team has achieved the biggest win by runs?
Which fielder has taken the most catches in a match?
Who has played the best innings in a losing cause based on Rating points?
Which bowler has conceded the most runs in his spell?
To determine that the answers are John Edrich, England, Ajinkya Rahane, Aiden Markram, and Chuck Fleetwood-Smith, I would run some specific analyses on my database. But note the highlighted words - greatest, biggest, best, and most. These words imply that these are all outliers. Finding them is the kind of thing I normally do.
However, in this article, I am going the other way - not going after outliers, but looking for equality, closeness, and being in a cluster. In other words, I look for non-outliers. I will stick to Test matches only in this article; the ODI format has its own idiosyncrasies and will be covered later.
The seed for this article was planted by reader Steve Morris from Australia. In an email, he referred to David Boon's highest score being 14.4% of the team score in a match featured in my last article. He wondered whether there were similar such low percentage values. That kindled my interest. I shelved the article I was working on and switched to this one. My thanks to Steve for planting the acorn that has grown into an oak.
This is a fun article; take it as such. Do not read too much into its specific content.
Batters
The first table relates to the specific query raised by Steve - the lowest percent of team score achieved by the top scorer. In three innings the percentage values were lower than that of Boon. Nasser Hussain's 15 out of 110 in 1998 was only 13.6% of the team score. There were six scores between 10 and 15. In Cape Town in 2005, England scored 304, and amazingly, Steve Harmison's 42, batting at No. 11, was the highest score. Nine batters scored between 19 and 42. In Multan in 2001, Bangladesh scored 134 and Mehrab Hossain's 19 was the top score. Eight batters scored between 10 and 19.
The first table relates to the specific query raised by Steve - the lowest percent of team score achieved by the top scorer. In three innings the percentage values were lower than that of Boon. Nasser Hussain's 15 out of 110 in 1998 was only 13.6% of the team score. There were six scores between 10 and 15. In Cape Town in 2005, England scored 304, and amazingly, Steve Harmison's 42, batting at No. 11, was the highest score. Nine batters scored between 19 and 42. In Multan in 2001, Bangladesh scored 134 and Mehrab Hossain's 19 was the top score. Eight batters scored between 10 and 19.
In the Boon match, in fourth place, Australia scored 471, and incredibly, Boon's 68 was the top score. Seven Australia batters scored between 35 and 68. And, to boot, there were 58 extras - the eighth "batter".
In 2017 in Adelaide, Australia scored 138, with Usman Khawaja and Mitchell Starc tying for top score with 20 each being the top scores, and eight batters scoring between 11 and 20.
For the next table, below, I decided to extend the concept of highest individual score percentage to the highest partnership percentage, with a slight increase in qualifying limit to 16%, so as to get a decent number of entries. An amazing innings was played in Brisbane in 1931. West Indies scored 148 in their second innings. The highest partnership was merely 20 runs -and that was for the last wicket. It is hard to believe, but each of the ten partnerships was between ten and 20 runs. That resulted in an unbelievable Coefficient of Variation (CoV) value of 0.214.
In 2018, Australia's final innings of 291 in Adelaide had 41 as its highest partnership score, for the eighth and sixth wickets. The lowest partnership was 16. There were four partnerships between 31 and 32. Ten batters reached double figures. Coincidentally, India's win margin was by 31 runs.
The next table is about groups of batters in an innings being in close proximity in terms of scores. A few examples will help explain this better.
In the Multan Test of 2001, four of the Pakistan batters had scores of 101, 104, 105, and 102. And a fifth scored 110. That is a close grouping indeed. Australia had four batters in the sixties at the SCG in 1952. And so on. Three innings had four batters in their fifties. One had five batters in their 40s. Finally, going back to the Multan game again, Bangladesh created their own record when they had eight batters scoring between 10 and 19.
This table is the quirkiest of all. This one identifies batters, within the same innings, who have figures identical to each other's (runs-balls-fours-sixes). With silent apologies to those batters in the first half of the history of Test cricket, for whom some of these figures were not incorporated on the scorecard, I identify those whose figures are identical. I only look for batters who have scored ten runs or more. Else we will have a number of batters who were out on their first ball on the list. Readers can see that, barring a stray 1911 instance, the others are innings played after World War II. There are two instances of the number of balls exceeding 50.
Bowlers
Let me now extend this concept to the bowlers. First, let me say that all "Overs.Balls" figures have been computed using the BpO value for the concerned match. The first table features those instances in which five bowlers shared the ten wickets that fell equally. Readers will note the presence of four such instances in the last ten years.
Let me now extend this concept to the bowlers. First, let me say that all "Overs.Balls" figures have been computed using the BpO value for the concerned match. The first table features those instances in which five bowlers shared the ten wickets that fell equally. Readers will note the presence of four such instances in the last ten years.
The next table features those rare instances when two bowlers bowled unchanged and took five wickets each. And, importantly, no other bowler bowled. All the instances are pre-WWI. Maybe those uncovered pitches helped teams run through the opposition with just two bowlers. There are combinations of spinners and pace bowlers together. And spin-only or pace-only. Maybe the two best bowlers bowled. It is interesting to note the number of overs bowled by two bowlers unchanged. In one case, 24 six-ball overs each. Compare with the present, when the bowlers bowl four overs in two spells and then retire to the pavilion.
There are instances of well-known pairs of bowlers running through teams. Examples are Fazal Mahmood and Khan Mohammed, Richie Benaud and Alan Davidson, Dennis Lillee and Gary Gilmour/Terry Alderman, Kapil Dev and Madan Lal, Wasim Akram and Waqar Younis, et al. However, in each of these cases, there was a third bowler who bowled a few overs.
The identical-analysis concept works well for all bowlers since the complete bowling analysis has to be incorporated into the scorecard, whether it is a 2020 one or 1920 one. This time I look for total congruence in the balls-maidens-runs-wickets figures. The minimum number of balls to be bowled for consideration is 30. It is interesting to note that Graham McKenzie and Rohan Kanhai features in two such instances, each in the same year. (It is to be noted that the four overs bowled by McKenzie were eight-ball overs, and so they make the 30-ball cut-off.)
Fielders
Let us now move on to the fielders. I was hoping that I would be able to locate a Test innings in which ten different fielders took one catch or effected a stumping. Unfortunately, that Test is still to be played. No Test innings exists in which ten fielders were active. I have two instances of nine fielders being involved in a catch/stumping, and a few other instances of eight fielders being successful. These are featured here. In the West Indian innings in Bridgetown in 2002, nine New Zealanders took nine catches. The tenth wicket was a Daniel Vettori delivery that broke Brian Lara's stumps. A decade later, nine Australian fielders shared the spoils against South Africa in Johannesburg; the tenth wicket was the lbw dismissal of Vernon Philander.
Let us now move on to the fielders. I was hoping that I would be able to locate a Test innings in which ten different fielders took one catch or effected a stumping. Unfortunately, that Test is still to be played. No Test innings exists in which ten fielders were active. I have two instances of nine fielders being involved in a catch/stumping, and a few other instances of eight fielders being successful. These are featured here. In the West Indian innings in Bridgetown in 2002, nine New Zealanders took nine catches. The tenth wicket was a Daniel Vettori delivery that broke Brian Lara's stumps. A decade later, nine Australian fielders shared the spoils against South Africa in Johannesburg; the tenth wicket was the lbw dismissal of Vernon Philander.
The next fielding distinction is a rare occurrence. These are Test innings in which two fielders dismissed four batters each. In Faisalabad in 1987, Ashraf Ali and Aamer Malik dismissed four each. The other batters were bowled. At Headingley in 2019, Tim Paine and David Warner caught four batters each.
Teams
Finally, I dove deep into the database to identify those teams that achieved equality, more by chance than by intention. The first table lists teams that finished close to each other in all four innings. Maybe this is the result of my fascination with the scores in that famous three-run win by England in Melbourne in 1982. The first match featured is a narrow win for England in 1890 - a Test in which all the four innings scores were within ten runs of each other. The next one is the MCG Test, which was a close draw. All the scores were within six runs of each other. Finally, that famous three-run win in 1982, when ten runs separated the four innings. It is clear that once we set the bar high, the number of Tests come down dramatically.
Finally, I dove deep into the database to identify those teams that achieved equality, more by chance than by intention. The first table lists teams that finished close to each other in all four innings. Maybe this is the result of my fascination with the scores in that famous three-run win by England in Melbourne in 1982. The first match featured is a narrow win for England in 1890 - a Test in which all the four innings scores were within ten runs of each other. The next one is the MCG Test, which was a close draw. All the scores were within six runs of each other. Finally, that famous three-run win in 1982, when ten runs separated the four innings. It is clear that once we set the bar high, the number of Tests come down dramatically.
All of us are aware of the two Tests that ended with the scores level. One was a perfect tie with all 40 wickets falling, leaving nothing on the table. The other was a slightly imperfect tie, with Australia losing only 12 wickets. However, there are a few instances in which the two teams achieved equality in the first innings. Perhaps the most noteworthy of these eight Tests is the Antigua one in which Lara scored 375; England matched a very high score. And there are a couple of other Tests in which the teams achieved parity on 400-plus innings.
I close this breezy, laid-back piece with a table on the teams that huffed and puffed but finally finished with completely matching runs-per-over values. I was amazed at the number of Tests that ended with this overall level of equality - no fewer than 19. The most notable among these might be the 2015 Test at the WACA, which finished with a run rate of exactly 4.00 for Australia and New Zealand. Two high-scoring first innings led the way to a high-scoring draw. Many of these matches produced results. The scoring rates displayed are based on the balls-per-over figure that was in force in that Test. Two of the Tests featured here, the ones played at Wellington and Brisbane, had eight-ball overs.
Batting and Bowling rating updates
January 28 was a red-letter day in sport. Jannik Sinner came from two-sets down to win his first Australian Open. Rohan Bopanna basked in the glory of a Grand Slam win, achieved the previous day, despite being nearer 45 than 40. Then the underdogs had their day. West Indies secured a memorable eight-run win over Australia through the bowling efforts of one injured bowler. England, written off by many, secured a stunning back-from-the-brink win in Hyderabad against the mighty Indians, through two memorable batting and bowling performances. These had a serious impact on my Bat-100 and Bow-100 analyses tables. It is amazing that three performances entered the top ten of these two tables on the same day.
January 28 was a red-letter day in sport. Jannik Sinner came from two-sets down to win his first Australian Open. Rohan Bopanna basked in the glory of a Grand Slam win, achieved the previous day, despite being nearer 45 than 40. Then the underdogs had their day. West Indies secured a memorable eight-run win over Australia through the bowling efforts of one injured bowler. England, written off by many, secured a stunning back-from-the-brink win in Hyderabad against the mighty Indians, through two memorable batting and bowling performances. These had a serious impact on my Bat-100 and Bow-100 analyses tables. It is amazing that three performances entered the top ten of these two tables on the same day.
- Ollie Pope's innings gathered 830.3 points and is in 9th position, just ahead of Graham Gooch's 154
- Tom Hartley's seven-wicket haul got 886.3 points and is in third position, just behind Stuart Broad's 8 for 15. Fanie de Villiers' spell continues to rule the roost at the top
- Shamar Joseph's bowling performance was worth 860.6 points and is in eighth position.
Largest variation in RpW values
From August 2023 onwards, I have added a section to my column, in which I present a numerical/anecdotal outlier relating to Test and ODI cricket. This time:
From August 2023 onwards, I have added a section to my column, in which I present a numerical/anecdotal outlier relating to Test and ODI cricket. This time:
Which Tests had the widest variation in the RpW (runs per wicket) values of the two teams (a total contrast to the theme of this article)? The top three values are given below.
In Christchurch in 1999, New Zealand scored 168 and 127 for 1, leading to an RpW value of 26.8. South Africa scored 442/1, leading to an RpW value of 442. The difference was a mammoth 415.2 runs.
In Lahore in 2006, Pakistan scored 679 for 7, which gave them an RpW value of 97.0. India scored 410 for 1 - an RpW value of 410. The difference was 313.0 runs.
At The Oval in 2012, England scored 385 and 240, finishing with an RpW value of 31.3. South Africa scored 637 for 2, for RpW value of 318.5. The difference was 287.2 runs.
Talking Cricket Group
Any reader who wishes to join my general-purpose cricket-ideas-exchange group of this name can email me a request for inclusion, providing their name, place of residence, and what they do.
Any reader who wishes to join my general-purpose cricket-ideas-exchange group of this name can email me a request for inclusion, providing their name, place of residence, and what they do.
Email me your comments and I will respond. This email id is to be used only for sending in comments. Please note that readers whose emails are derogatory to the author or any player will be permanently blocked from sending in any feedback in future.
Anantha Narayanan has written for ESPNcricinfo and CastrolCricket and worked with a number of companies on their cricket performance ratings-related systems