How do you rank the best Test bowling performances of all time?
Breaking down the method involved to come up with a rankings list
Anantha Narayanan
22-Jul-2023
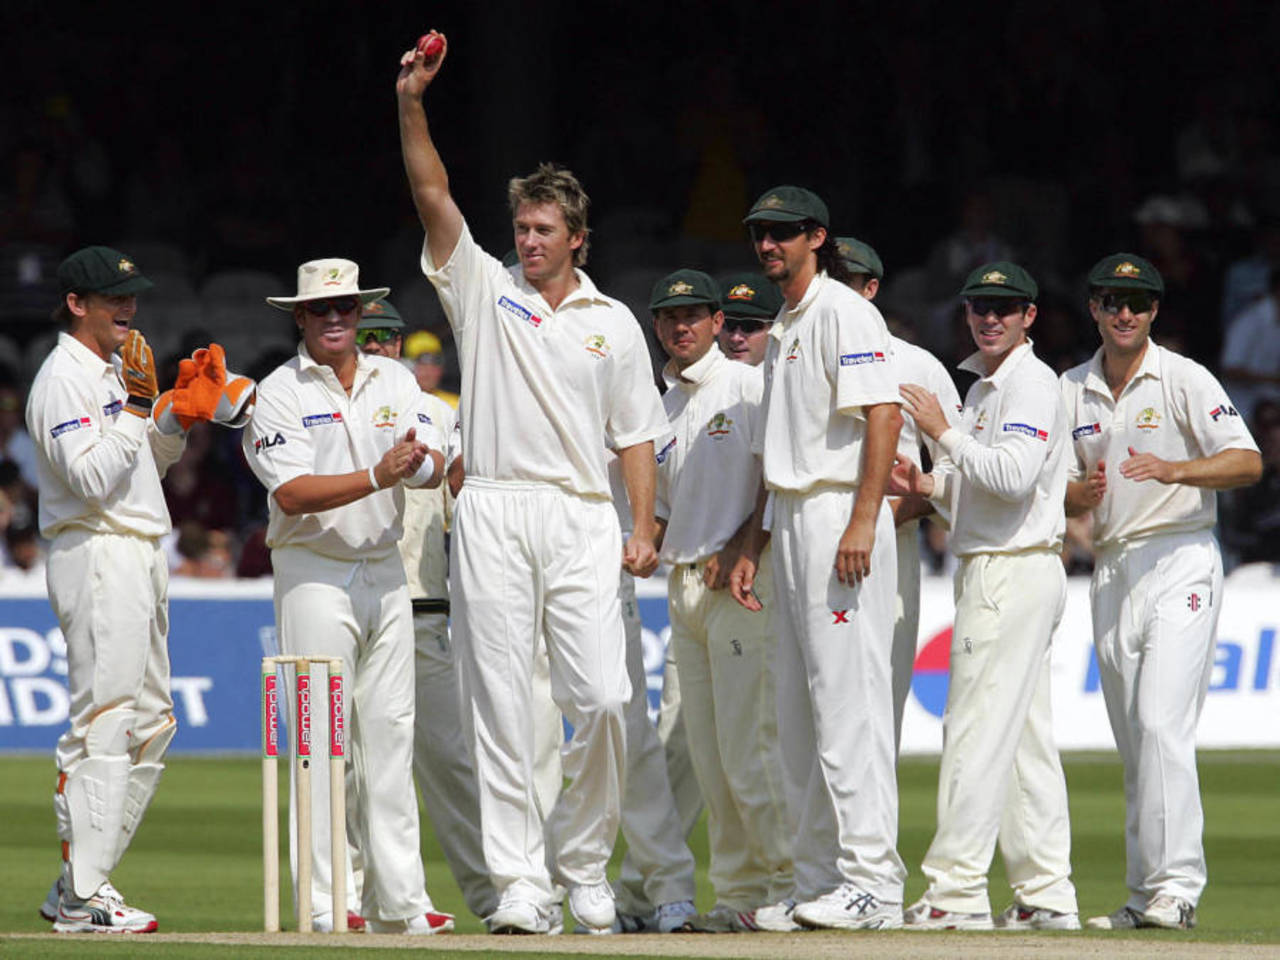
Where does Glenn McGrath's knocking over of five England's top six batters at Lord's in 2005 rank on the list of best bowling performances? • Hamish Blair/Getty Images
From this article onwards, I have a new section where I will present a stat nugget relating to Test or ODI cricket. I start with this intriguing question: Which bowling figures occur most in Test cricket? The answer is at the end of this article.
The analysis in this article is a complete revision of the historic and epochal Wisden top 100 bowling performances released in 2001, and the revised version, called the Red Cherry 25, which was published on ESPNcricinfo in 2018. In the 22 years since the Wisden 100 was published, there have been many insights, suggestions and data revelations, and a far better conceptual understanding of this ranking. This article presents a new "Bow-100" table, incorporating many improvements - conceptually, contextually, and in terms of factors taken into account - in breadth and depth.
The basic idea remains the same - a bouquet of the 100 best Test bowling performances. The new list is as exciting as the first, since there have been many wonderful performances in the last 20 years - no fewer than 34 of the 100 come from this period. We have had an opening-day performance par excellence by Stuart Broad. We have had a last-innings performance for the ages by Muthiah Muralidaran at Trent Bridge. We have had Glenn McGrath dismissing five of the top six English batters for a combined total of 15 runs at Lord's. Who can ever forget Ajit Agarkar's match-winning spell in Adelaide in 2003 after the two teams had accumulated nearly 1100 runs in three days?
A new term, familiar to my old readers, is used in this article: "innspell" refers to the complete bowling figures of the bowler in the innings, as compared to shorter spells within an innings.
Bowling vs batting
Bowling dynamics are quite different to batting ones. At the MCG in 1932, Australia scored 153 but won by an innings and 72 runs. At Old Trafford in 1888, England scored 172 and won by an innings. This shows that the number of runs batters in a team need to score varies widely. However, bowlers consistently need to take 20 wickets to win Tests. Until now, there have been 1715 wins in Tests and in 1679 of these, 20 wickets have been taken by the winning team. The overall average for the winning team is 19.9 wickets taken per Test.
Bowling dynamics are quite different to batting ones. At the MCG in 1932, Australia scored 153 but won by an innings and 72 runs. At Old Trafford in 1888, England scored 172 and won by an innings. This shows that the number of runs batters in a team need to score varies widely. However, bowlers consistently need to take 20 wickets to win Tests. Until now, there have been 1715 wins in Tests and in 1679 of these, 20 wickets have been taken by the winning team. The overall average for the winning team is 19.9 wickets taken per Test.
Another huge difference is that even a single batter (Dennis Amiss, Hanif Mohammad, Michael Atherton from the Bat-100 analysis) can bat long enough to take a team to a draw. It is easy to recognise these batters' performances - the mentioned three performances are in the top 25 of the Bat-100 table. It is difficult for a bowler to do the equivalent. While bowlers can take 20 wickets and pave the way for wins, in general, only batters can save matches. Similarly, taking 20 wickets for a small number of runs may not be enough - as at Lord's in 1888, when the English bowlers dismissed Australia for 116 and 60, but still lost the match.
The other major difference between batting and bowling is that only the final score has to be considered for the batter. Say, a batter made 104 runs. How he scored these runs, whether he took the bulk of them off the stronger bowlers or not, whether or not he played strategically to take the initiative, what his score-distribution pattern was, are not factors that we look into. And all the relevant data for such analyses is not available publicly anyway. However, when we analyse bowlers' performances, we need to consider both aspects - the innspell and the individual wickets taken. In terms of value to the team, a four-wicket bag could be far more important than a seven-wicket one. The individual wickets do tell a powerful story.
Methodology
In 2001, the work I did was a single run-through of a common process across all innings. In 2018, I improved that concept significantly, but the overall model was similar. The most important thing I have learnt during these two decades is that the four innings vary considerably, and that I would be well advised to run the whole process for each innings separately. The parameters vary significantly across the innings and bowling strategies used in the four innings are chalk and cheese when compared to each other.
In 2001, the work I did was a single run-through of a common process across all innings. In 2018, I improved that concept significantly, but the overall model was similar. The most important thing I have learnt during these two decades is that the four innings vary considerably, and that I would be well advised to run the whole process for each innings separately. The parameters vary significantly across the innings and bowling strategies used in the four innings are chalk and cheese when compared to each other.
The first and second innings are somewhat similar, with minor variations. The team batting first has a target to aim at - based on recent history in the country where the match is being played. Consequently, the team bowling first has a contra-objective of getting the other team out for a score as far behind that target as possible. On batting wickets, the goal is to restrict the first innings to a reasonable level. In the second innings, the bowling team has to work with either a low total scored by their batters, making their life difficult, or a really high total scored by their team, making life easy, or something in between.
The third innings is, arguably, the most complex of the lot. Leaving aside the matches in which one team has a 200-plus lead, making strategy wholly redundant, the other Tests present multiple conundrums, especially for the bowling team. Do they bowl in a holding pattern, letting the other team decide what target to set, or do they go all out to take wickets, maybe conceding runs in the bargain? Even experienced captains do not solve this problem effectively. The scores in the first two innings do, however, provide a clear indication regarding the pitch: a 150-plays-150 situation needs to be handled completely differently from a 400-plays-400 situation.
The fourth innings is the simplest of all. The team bowling fourth has a single figure in front - the target score, before which they need to take ten wickets. Unlike the team batting, they have no option to aim for a draw. The target has ranged from 1 to 836 in Test history. Currently, any targets above 420 become almost certain wins for the bowling teams or draws. Any low total to defend presents only one option - go for a win by dismissing the other team for a lower score still. If you are defending 110, the only numbers that matter to you are 109 and ten wickets.
In view of their similarities, I have combined the first and second innings together and run a common process, identifying and handling a few differing situations, mainly target-related, within the process. I have then considered the third and fourth innings independently. I took the interim ratings points, out of a maximum of 100, summarised the values across the four innings, and studied various statistical parameters - mean, distribution, minimum and maximum for each innspell. I then applied multiplying factors for each innspell that vary by around 5% among them, to derive a final Bow-100 value. The numbers are fixed in such a manner that a Bow-100 rating points of 1000 - the ultimate performance - will almost certainly never be reached.
The whole process is quite complex and cannot be explained in its entirety without program codes. However, I have tried to provide an overall blueprint of the whole system here.
Multiplicative vs additive
Each innspell is valued on 12 parameters. There are two ways to arrive at the final Ratings Values. One is to take a base parameter, such as "wickets taken", assign a base point value to it, determine the multiplicative factor for each of the 11 parameters and multiply the base value with these indices. I adopted that approach for my real value of wickets analysis, where the base parameter was clearly defined. And I was ready to accept that a spell of four wickets might be valued at 5.8 and a nine-wicket spell at 7.5. The first is indicative of a positive spell and the second, a negative one.
Each innspell is valued on 12 parameters. There are two ways to arrive at the final Ratings Values. One is to take a base parameter, such as "wickets taken", assign a base point value to it, determine the multiplicative factor for each of the 11 parameters and multiply the base value with these indices. I adopted that approach for my real value of wickets analysis, where the base parameter was clearly defined. And I was ready to accept that a spell of four wickets might be valued at 5.8 and a nine-wicket spell at 7.5. The first is indicative of a positive spell and the second, a negative one.
However, the ratings process here is totally different. A 4 for 10 by Bill Voce should have as good a chance to be ranked comparably with a 6 for 23 by Fanie de Villiers or an 8 for 15 by Broad. This can never be achieved in a multiplicative process. The high base value of eight, nine or ten wickets would trump everything else. So it is necessary that the wickets taken need to be one parameter, with a reasonable weight, the other parameters need to have values, and the final score needs to be arrived at by a process of addition.
Parameter weights
Some sceptics might question the concept of the parametrisation methodology. I have always stood by that method as the fairest one to determine the value of an innspell. And it has worked very well when one considers the final results. Not one of the top 25 bowling performances is out of place.
Some sceptics might question the concept of the parametrisation methodology. I have always stood by that method as the fairest one to determine the value of an innspell. And it has worked very well when one considers the final results. Not one of the top 25 bowling performances is out of place.
The only subjective elements in this process are the weights. However, I believe my quarter-century of cricket analysis has helped me arrive at the weights in an informed and fair manner. My knowledge of almost all the top innspells that have been performed and many trial runs have helped me work out fair parameter weights. I have made extensive use of statistical measures to validate the weights.
The most significant change in this analysis is that the wickets-taken parameter has only a 10% weight. This has allowed no fewer than 24 four/five-wicket performances to feature in the Bow-100 table. Taking many wickets is not enough to get featured. Only 24 Bow-100 performances are of eight or more wickets each. There are 20 nine-wicket performances and only seven of these have found a place in the Bow-100. None of the three ten-wicket performances finds a place, despite there being a special bonus in the analysis for taking all ten wickets. The context is interesting - Jim Laker took his ten when England were 375 runs ahead in a follow-on; Anil Kumble, when defending a huge target of 420; and Ajaz Patel, in a huge loss against India.
Similarly, the weight for wins has also been kept at around the sub-10 level. This has allowed quite a few performances in drawn and lost matches to reach the top echelons. Fourteen innspells played in drawn matches and three in defeats are in the Bow-100.
Now let us move on to the parameters, their weights and examples.
Parameters
1. Wickets taken (10.0)
This a straightforward parameter, except that the base value is allotted depending on the batting positions of the batters dismissed. This is a significant departure from the previous linear point allocation. The idea is that top-order wickets, be they the batters of Australia 1948 or of Bangladesh 2002, are important ones and have more value than the lower-order wickets. The values are listed below.
This a straightforward parameter, except that the base value is allotted depending on the batting positions of the batters dismissed. This is a significant departure from the previous linear point allocation. The idea is that top-order wickets, be they the batters of Australia 1948 or of Bangladesh 2002, are important ones and have more value than the lower-order wickets. The values are listed below.
A brief explanation of the handling of nightwatchers. If a batter at Nos. 1-7 is determined to be a nightwatcher, in all probability, he usually bats between No. 9 and 11. It is very unlikely that a No. 8 batter is sacrificed for that role. The basic idea is that the nightwatcher's wicket is expendable. And there is a two-thirds chance that he is one of the last two batters. Considering all these things, his wicket is allotted 0.3 points. This will ensure that the total for the full line-up, of 10.0, is never exceeded. It is important to remember that information on the nightwatcher's original scheduled batting position is not available.
The subsequent batters are allotted their initial allocation of points. And if there was more than one nightwatcher (Australia vs England, Melbourne, 1902, England vs Australia, Lord's, 1985, Pakistan vs England, Faisalabad, 1987), the appropriate number of batters, batting at lower positions, would be in the 1.25 range. Thus, the total will not exceed 10.0 points. Overall, this works very well.
Concussion substitutions are accounted for. Let us say the ball hits a batter on the helmet hard and then goes on to hit the stumps. Or the ball hits the bat, then the helmet and the player is caught. The batters have been dismissed in these instances but also concussed. They are permitted to be substituted as fielders but not as batters in the same innings. However, in a normal concussion situation, the concussed player will remain not out, so his points will pass on to the batter who replaces him.
This structure will allow for a situation where ten wickets are lost in which one of the top six batters remains unbeaten to take 9.05 points, a loss of nine wickets in which the top nine batters are dismissed to gather 9.7 points, and a loss of eight wickets in which the top eight batters are dismissed to gather 9.2 points. All these make sense. A maximum of 10.0 points are allocated for this parameter.
Fanie de Villiers gets 6.0 points for his mixed haul of six wickets at the SCG in 1994, while Stuart Broad gets 7.5 points for his six top-order wickets at the Wanderers in 2016.
2. Bowling strike rate (BpW - 5.0 to 8.0)
3. Bowling accuracy (RpB - 2.0 to 5.0)
Test matches are won by taking 20 wickets within a fixed window of time, barring a few matches in which innings are declared closed. As such, the bowling-strike-rate parameter is very significant. At the same time, there has to be control in the form of lower scoring rates. Hence, these two parameters have to be looked at in conjunction, as indeed they are in this exercise.
A maximum of 5.0 to 8.0 points are allocated for the strike-rate parameter. The maximum allocation is for a strike rate of 1. A poor strike rate (120 BpW for the first two innings and 100 for the latter two innings) fetches zero points, and any strike rate in between is proportionally allocated. This tweak is necessary because the BpW values drop significantly between the first/second and third/fourth innings.
The bowling-accuracy parameter is important since not all bowlers are capable of taking wickets frequently. It is essential for all bowlers to keep a tight check on the scoring rate, to ensure that the scores do not get out of hand. A maximum of 2.0 to 5.0 points are allocated for the bowling-accuracy parameter. The maximum allocation is for an RpO value of 0.0. A high RpO of 6.0 fetches zero points and anything in between is proportionally allocated.
The maximum points for these two parameters are dynamically determined for innings No. 2 through 4. However, the total is always 10.0 points. Care is taken that the maximum for the strike-rate parameter never falls below 5.0 points.
In the first innings, since there is no match data available, the two parameters are allotted 5.0 points each. This is a recognition of the fact that both measures are equally important in that innings.
In the second innings, if the bowling team is defending a low total, the strike-rate parameter is given more points. If they are defending a high total (400-plus), the two parameters are allotted 5.0 points each.
There is a clear target in front of the batting team in the third innings. Based on this target, the maximum for the strike-rate parameter is moved up. In general, the lower the target is, the higher the strike-rate maximum value will be.
However, in the fourth innings, the role of these two parameters begins to be more clearly defined. In situations in which a low target, such as 100, is being defended, it is very important to take wickets quickly, and RpO takes a back seat: 10-0-56-8 is more likely to be a winning spell rather than 20-5-32-2. In situations in which a middling-to-high target, such as 300, is being defended, both parameters are important. In situations in which a high target, such as 400, is being defended, it is important to have a tight hold on the scoring rate also; the wickets will usually come in due course. So I process the fourth-innings numbers in a nuanced manner, combining both parameters. However, it must be remembered that information on how many overs are available to score runs/take wickets is not available.
Broad's blink-and-you-miss-a-wicket spell of eight wickets in 57 balls at Trent Bridge in 2015 gets him 6.6 strike rate points, while Jack White's eight wickets in 389 balls against Australia in 1929 gets him only 2.8 points.
Muralidaran's economical 65 runs in 54.2 overs at The Oval in 1998 fetches him 4.0 bowling accuracy points, and Ashantha de Mel's expensive 14.0-0-68-5 against India in 1982 gets him only 0.6 points.
Batting quality faced (12.5)
The batting quality is determined by looking at the top seven batters from the batting team by averaging their career-to-date location batting averages. The location split is home and away. Thus, the relevant numbers come into the picture. In addition, recent form is incorporated by giving 25% weight to the batting average in the last ten Tests the batter played, across locations.
The batting quality is determined by looking at the top seven batters from the batting team by averaging their career-to-date location batting averages. The location split is home and away. Thus, the relevant numbers come into the picture. In addition, recent form is incorporated by giving 25% weight to the batting average in the last ten Tests the batter played, across locations.
The best batting line-up was that of India against Sri Lanka in the Galle Test of 2010. Gautam Gambhir, Virender Sehwag, Rahul Dravid, Sachin Tendulkar, VVS Laxman, Yuvraj Singh and MS Dhoni clocked in at 47.3. Their career-to-date averages were high (three above 50) and their recent form was terrific. The ICC team of 2005 that played Australia has a slightly higher figure, but that was not really a Test team.
A maximum of 12.5 points are allocated for this parameter. This allocation is for a BQI value of 50.0.
Tony Greig faced a top quality West Indian batting line-up Indies in Port-of-Spain in 1974 (BQI of 44.2) when he took 13 wickets, and this fetched him 11.0 points. Devon Malcolm was up against a middling set of South Africa batters at The Oval in 1994 (BQI of 27.3), when he took 9 for 57 in the third innings, and secured only around 6.8 points.
5. Nature of pitch - Last Ten Years' Pitch Performance + PQI (12.5)
This intricate measure is used to assess the quality of the pitch. This score is compiled in two steps. The first is based on the last ten years' average RpW (L10PP) for the pitch. The most recent five years are given 100% weight and the five years before those, 50% weight. This value is limited to between 15 and 50.
This intricate measure is used to assess the quality of the pitch. This score is compiled in two steps. The first is based on the last ten years' average RpW (L10PP) for the pitch. The most recent five years are given 100% weight and the five years before those, 50% weight. This value is limited to between 15 and 50.
The second part relates to how the pitch has behaved in the current match. This is based on the complex measure called Pitch Quality Index (PQI). The relevant PQI value is used. For the first two innings, PQI-12 is used, while for the latter two innings, PQI-34 is used. Matches that do not go into the fourth innings have only a single PQI value.
A maximum of 12.5 points are allocated for this parameter. The L10PP parameter gets a 6.25 points allocation for a value of 50, and the PQI a 6.25 points allocation for a high PQI value of 100.
Bruce Taylor's 7 for 74 at Kensington Oval in 1972 was on a batter-friendly surface and he secured 9.6 points. The PQI was 55.3. Hugh Tayfield, on a pitch much more helpful to bowlers, took 9 for 113 against England in 1957 and this got him only 2.9 points. The PQI was 35.5.
6. Relative Bowling Average (3.0)
In parameters 2 and 3 above, I recognised the absolute values of the bowling strike rate and accuracy. It is also necessary to recognise the relative values - how a bowler performed relative to his compatriots. A couple of examples will help understand the need for this.
In parameters 2 and 3 above, I recognised the absolute values of the bowling strike rate and accuracy. It is also necessary to recognise the relative values - how a bowler performed relative to his compatriots. A couple of examples will help understand the need for this.
Let me take two different scenarios of an innings ending at 207 all out (seven extras), with the leading bowler claiming six wickets in both instances.
In the first instance, a bowler takes 6 for 30. His average is 5.0. The average of his compatriots is 42.5 (4 for 170). This bowler has performed 8.5 times better than his colleagues since the ratio of bowling averages is 8.5. In the second instance, a bowler takes 6 for 80. His average is 13.33. The average of his compatriots is 30.0 (4 for 120). This bowler has performed 2.25 times better than his colleagues. It is obvious that the first bowler should be credited for outperforming his fellow bowlers by a large margin. His contribution in dismissing the opposing team for 200 is much more valuable.
After determining and limiting the ratio to 10.0, I assign a value of 3.0 points as Relative Bowling Average parameter value for the ratio of 10.0 and proportionately for lower values. The first bowler in the example above gets an RBA value of 2.55 points (3.0*8.5/10.0) and the second, 0.675 points (3.0*2.25/10.0).
Richard Hadlee, with his spell of 9 for 52 in Brisbane in 1985, outperformed his fellow bowlers (1 for 127) by a huge margin and gets a RBA value of 3.0. Abdur Rehman, for his match-winning Abu Dhabi spell of 6 for 25, in which he dismissed England for 72, got an RBA of only 0.7 points. Readers can work out the numbers in both cases.
7. Wicket-Level Points (22.0)
This is, inarguably, the most important parameter of all. It has been picked up from the work I did with regard to determining the Real Value of Wickets. In view of the high weight for this parameter, let me explain the whole process.
This is, inarguably, the most important parameter of all. It has been picked up from the work I did with regard to determining the Real Value of Wickets. In view of the high weight for this parameter, let me explain the whole process.
The idea is that unlike batters, who come in at a certain stage in the innings, bat for some time, and then get out, bowlers bowl "x" number of balls. Any ball could end in something great - say, the dismissal of Don Bradman, or the fall of the last wicket when a single is needed. Or it could end in conceding a six off the last ball when six runs are needed to win. Or any other outcomes in between. So I specifically look at each wicket taken and derive multiple insights from the same about the impact it had on the innings. I derive four insights, as below.
a. Who was dismissed? The wicket could be that of Bradman or that of Chris Martin or someone in between, like Tony Greig. We cannot treat all the wickets taken the same. Credit is given based on the career-to-date location-based batting average of the batter dismissed. It is also clear that dismissing a top batter is important, at any stage of the innings.
b. At what score was he dismissed? Dismissing Garry Sobers at 112 is one thing. Dismissing the great batter at 0 is a totally different scenario altogether - maybe the difference between a loss and a win. I give credit if the batter was dismissed at or below a value derived from his runs per innings and his recent form. At times it could mean that dismissing Bradman at 150 would get zero points, while dismissing James Anderson on zero will get some points.
c. What was the match status at the dismissal point? This is totally context-based. The most important wicket in history was when Craig McDermott was dismissed in Adelaide in 1993 by Courtney Walsh, or when James Anderson was out to Neil Wagner recently at the Basin Reserve. A single was needed to win in both cases. Everything was on the line on those balls.
d. What happened afterwards? Greater weight is given to wickets that do not allow partnerships to be formed. In other words, proximate wickets are given more credit.
The points for all the wickets taken by the bowler are summed. Stuart Broad's 8 for 15 secured a very high total WLP (Wicket-Level Points) of 162.2 points. Then the average per wicket is determined. Bill Voce's 4 for 10 has an average of 31.37 points per wicket.
Finally, the points are allotted on the following basis, so that both quantity and quality are recognised.
Twelve points are allotted for the Total WLP secured. The maximum is for a total WLP of 165 points. Ten points are allotted for the average WLP per wicket. The maximum is for an average WLP of 32 points.
McGrath's magnificent Lord's spell of five top-order wickets in single figures netted him 18.8 points. Angus Fraser's eight wickets in Bridgetown were mostly of set batters and secured him only 10.2 points.
8. Match Status (7.5)
For the batters, I have clear and precise data to determine at what stage of the innings they entered and the progress made, or lack of it, while they were at the crease. That is not possible with bowlers. The only certain information we have is who bowled the first and last balls. We know how the innings status changed. But we cannot relate the bowlers' bowling to such status changes. As such, I can only associate the match status with all the bowlers who bowled in the innings.
For the batters, I have clear and precise data to determine at what stage of the innings they entered and the progress made, or lack of it, while they were at the crease. That is not possible with bowlers. The only certain information we have is who bowled the first and last balls. We know how the innings status changed. But we cannot relate the bowlers' bowling to such status changes. As such, I can only associate the match status with all the bowlers who bowled in the innings.
The match status is determined by using a measure called WIP (Win-Percentage). This is the winning percentage chance for the batting team. I determine this at the beginning of each of the four innings. I will look at the first three innings in an overall manner and the fourth innings in depth.
First Innings: At the beginning of the match. This is based on the relative team strengths.
Second innings: This depends on the first-innings score. Let us work on the basis that the target score for the first innings is 361. A first-innings score of 361 will have the WIP value at 50%. A higher score will make this above 50 and a lower score will move this below 50. All values are subject to limits between 2% and 98%.
Third innings: This depends on whether the team batting third has a lead or deficit, and what the margin of lead or deficit is. In general, the greater the lead, the lower the WIP value and the greater the deficit, the higher the WIP. In addition, the team that enforces the follow-on is very comfortably placed and they will be at 2%.
Fourth innings: This depends on the target that the team has been set. The calculations are totally different for the fourth innings. For a normal no-follow-on sequence, I determine a Base-RpW value using the formula
Base-RpW for 4th innings = 0.2*RpW-1 + 0.3*RpW-2 + 0.5*RpW-3.
A brief explanation is in order: 20% of the opposition's first-innings RpW, 30% of own team's first innings RpW (because this reflects how this team batted first) and 50% of the most recent RpW (since this will be a clear indicator of how the pitch is behaving). The last mentioned RpW value's importance will be obvious when we look at two matches in which the scorelines are 132/178 improving to 285, and 553/489 dropping to 285. The 285 score takes diametrically opposite hues in the two matches.
Then I determine how many wickets will be needed to reach the fourth-innings target. A batting team's requirement of below one wicket gets a WIP of 2% for the bowling team, around nine wickets gets a WIP of 50%, and 20 wickets gets a WIP of 98%. The rest get extrapolated between 2% and 98%.
Bob Willis, in the famous Headingley Test of 1981, faced a very difficult situation of needing to defend 120 runs, and got 6.1 points. At the other end, Jim Laker, with a huge total of 459 runs behind him, got a mere 2.0 points for his spell of 9 for 37 at Old Trafford in 1956.
9. Innings Bowler Performance (10.0)
This again works quite differently to batting, and is based on the Innings Team Performance (ITP). ITP gives the base points indicating the extent of team achievement. The IBP points are allocated among the bowlers based on their individual contributions.
This again works quite differently to batting, and is based on the Innings Team Performance (ITP). ITP gives the base points indicating the extent of team achievement. The IBP points are allocated among the bowlers based on their individual contributions.
For the first three innings, the steps are simple. The targets for each innings are clearly defined and the final scores reached are available. A ratio between these two values is determined. The ratio is limited to between 0.25 and 2.0. Then ITP for the team is determined based on this ratio.
For the fourth innings, the situation is different. The target for the team bowling fourth is taking ten wickets. A winning team does that. However, it is clear that a bowling group that defends a 120-run target and wins by ten runs deserves a lot more credit than one that carves out a 100-run win while defending 300. In turn, this second team deserves a lot more credit than a team that gets a 300-run win while defending 500. It is clear that the two contrasting parameters, the target and the margin of win, need to be considered together to determine the scale of achievement. This is done by the following method, for wins.
a = (400 - Target) / 70.0 (Maximum of 4.5).
b = (200 - Margin of win) / 44.22 (Maximum of 4.5).
ITP = 1.0 + a + b (Maximum of 10.0).
The formula is not as complicated as it seems. As of now, 85 is the lowest target defended. Hence the 400 and 70, so that the maximum points will be 4.5. And any defence of 400-plus scores gets only minimum recognition. Similarly, any win by above 200 runs is a huge win and the bowlers get only minimum recognition. A one-run win gets the bowler 4.5 points. Both (a) and (b) are set to 0 if they go below 0.
A few examples.
Draws and losses are handled based on the number of wickets that were taken by the team bowling fourth. Teams that went far ahead on the road to possibly winning the match get credit.
When South Africa defended a very low total of 117 in Sydney in 1994, they got almost full points. However, de Villiers had to share the points with Allan Donald and secured an IBP of 5.7 points. Similarly, England got a substantial number of points when they restricted Australia to 60 (the target being 320). Broad took most of these points (8.4).
10. Location-result-Team Strength (10.0)
This is a composite parameter incorporating the location, result and the Relative Team Strength index. The three locations - home, neutral and away, and the three results - win, draw and loss are combined to form a dual index, and a base value of between 0 and 8 is arrived at. Then the Relative Team Strength Index value, limited to 2.0 points, is arrived at and added to this value. For the two tied matches, both teams are deemed to have won the match each time.
This is a composite parameter incorporating the location, result and the Relative Team Strength index. The three locations - home, neutral and away, and the three results - win, draw and loss are combined to form a dual index, and a base value of between 0 and 8 is arrived at. Then the Relative Team Strength Index value, limited to 2.0 points, is arrived at and added to this value. For the two tied matches, both teams are deemed to have won the match each time.
A maximum of 10.0 points are allocated for this parameter. This allocation is for an away win by a team that is thrice as weak as the other team - say, a win by Afghanistan in Melbourne. Fazal Mahmood, who spearheaded the famous Pakistan win over England at The Oval secured 8.2 points.
11 & 12. Special Factor (2.5)
This is a partly subjective factor based on many emails, conversations and insights that I have received over the years. And while it is subjective, it is also based on a very clear understanding of the facts, and the final value is determined objectively. In general, these facts relate to the situations that cannot be identified or measured using scorecard data. In a way, this brings into the equation the intangibles that define the innspell. The three factors are identified below.
This is a partly subjective factor based on many emails, conversations and insights that I have received over the years. And while it is subjective, it is also based on a very clear understanding of the facts, and the final value is determined objectively. In general, these facts relate to the situations that cannot be identified or measured using scorecard data. In a way, this brings into the equation the intangibles that define the innspell. The three factors are identified below.
11a. The other team's form (Inns 1/2: 2.5 pts): The form of the opposing team is a significant factor at the start of a match. A team that comes in with, say, nine to ten wins on the trot, is going to be very tough to face. On the contrary, imagine facing a team that has avoided defeat just twice in the last ten Tests. This factor is a clear and accurate depiction of the form of the batters the bowlers face. The maximum of 30 points is given to a team with ten away wins in the last ten Tests, while a run of ten consecutive losses carries zero points. This factor is applicable only to the bowlers who bowl in the first and second innings. By the time two innings are completed, the effects of this factor wear off and the situation of the match being played takes over. The highest Form Index is that of the West Indian team at the MCG in 1984. They carried a value of 29.0 points.
When Allan Border, as a bowler, faced West Indies at the SCG in 1989, he was facing a team carrying a 25.5-point (out of a maximum of 30) streak in their last ten Tests and was given 2.1 points. Richard Hadlee when facing the Australian team at the Gabba in 1985 secured only 0.8 points as Australia were coming off a very poor 30% (9.0/30) recent performance streak.
12a. A win/draw after being in a tough situation in the third innings (Inns 3: 2.5 pts/1.25 pts): If the bowling team is faced with a huge deficit, they are on a hiding to nothing, and if they still win, they get credit, depending on the deficit. At the other extreme, if the bowling team has a big lead and wins, they are sitting comfortably. They get very little credit. Anything in between will be dealt with proportionately.
12b. A win/draw while bowling in the fourth innings (Inns 4: 2.5 pts/1.25 pts): If the batting team has a low target score, say 100, in front of it in the fourth innings, the bowling team is on a hiding to nothing. If they win, say by dismissing the batting team for 90, they get full credit. At the other extreme, if the batting team has a high target of 400-plus runs, the bowling team is sitting comfortably. They get very little credit. Anything in between, will be dealt with proportionately. In a way, this supplements the Innings Performance measure.
Huge Trumble, playing for Australia, and defending a mere 123 runs at Old Trafford in 1902, secured 2.3 points. Mathew Hoggard, while successfully defending a big total of 325 at the Wanderers, got only 0.5 points.
A summary visual of all the parameters and their assigned weights is shown below. The graph is self-explanatory.
The main Bow-100 article will follow in three weeks' time.
The stat nugget
The answer to the question at the head of this article: the most common bowling analysis in Tests is, surprisingly, 0 for 9. That has occurred 488 times in Test cricket. This is followed by 0 for 8, with 482 instances, and then 0 for 4, with 473. Among wicket-taking innings performances, it is 1 for 26, with 184 instances. From there, the highest by increasing numbers of wickets taken are 2 for 47 (135), 3 for 50 (88), 4 for 66 (58) and 5 for 63 (44). Why these have turned out this way is for the readers to speculate upon.
Talking Cricket Group
Any reader who wishes to join my general-purpose cricket-ideas-exchange group of this name can email me a request for inclusion, providing their name, place of residence, and what they do.
Any reader who wishes to join my general-purpose cricket-ideas-exchange group of this name can email me a request for inclusion, providing their name, place of residence, and what they do.
Email me your comments and I will respond. This email id is to be used only for sending in comments. Please note that readers whose emails are derogatory to the author or any player will be permanently blocked from sending in any feedback in future.
Anantha Narayanan has written for ESPNcricinfo and CastrolCricket and worked with a number of companies on their cricket performance ratings-related systems