Can the most memorable and forgettable Test series of all time be quantified?
Using the Test Quality Index to select the best games and series in Test history
Anantha Narayanan
13-Jan-2024
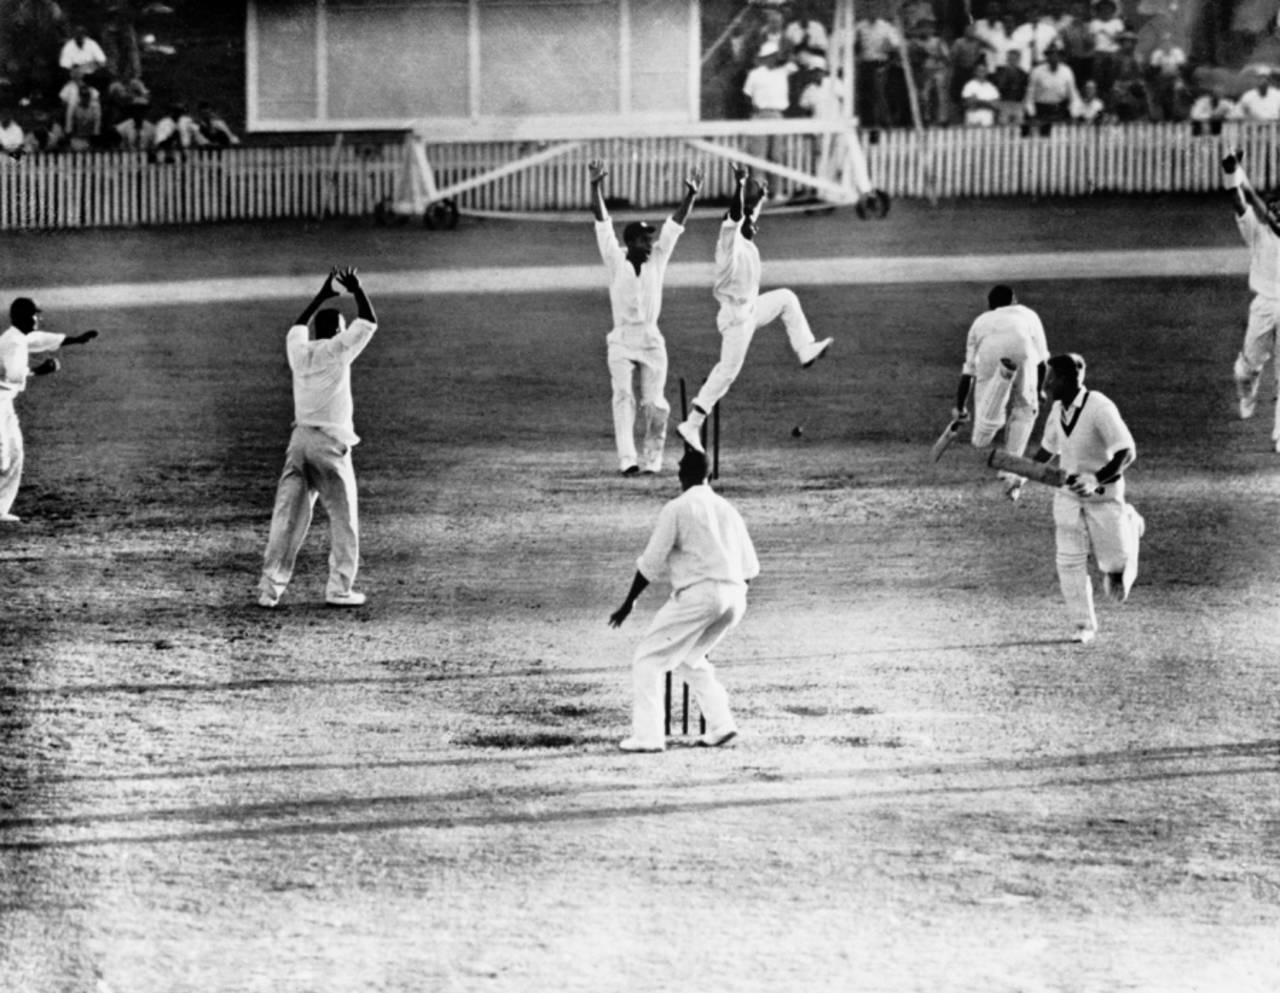
The Australia-West Indies series of 1960-61, featuring the first tied Test, is easily the best series of all time • Getty Images
For some time I have been working on a new concept. Basically, I wanted to assign for each Test a TQI value (Test Quality Index). Some Tests stay with us forever. Some are forgotten the next day. Some Tests are in the middle, bringing warm feelings when recalled. This index is a pointer to the nature of the Test. It is ironic but true that a big win, say by an innings or by ten wickets, does not make a great contest. On the other hand, a tight draw with eight or nine wickets down in the fourth innings could make for a great contest, not to be forgotten in a hurry. The best way to understand this concept is to have a non-partisan neutral view of the whole scenario.
The TQI runs from 10 to 1. Let us first look at a matrix indicating how the TQI values are allocated. The analysis is current up to and including the two Tests of the new year.
The matrix is self-explanatory. Additional explanations are given at the bottom. The maximum TQI value of 10.0 is given to the following Tests.
While the WTC finals might not have produced close contests, they are the pinnacle of Test cricket, as of now, and have to be recognised.
The innings wins need some more clarification. The victories achieved with winning totals below 300 (20 Tests) have been allotted seven points since the losing team has bowled reasonably well and there has been a good contest. The other Tests with innings wins are allotted six points.
A total of 30 Tests are identified as matches in which a world record was broken (two Tests - England vs Australia, Old Trafford, 1956 and Sri Lanka vs India, Colombo, 1997 - each have two records broken in them). A record-breaking Test is assigned a TQI value of 7.0, if the TQI otherwise derived is less than 7.0. If the TQI is greater than 7.0, that value is retained. There may be other records worth rewarding. But this is my selection and could be expanded.
- Team totals - high: 952/6
(Sri Lanka vs India, 1997)
(Sri Lanka vs India, 1997)
- Team totals - low: 26
(New Zealand vs England, 1955)
(New Zealand vs England, 1955)
- Team scoring rate - high (min 50 overs): 6.80 (South Africa 340 in 50 vs Zimbabwe, 2005)
- Max hundreds in innings: 5 (Australia, Pakistan)
- Sixes in a match: 37 (India vs South Africa, 2019)
- Fours in a match: 238 (Australia vs India, 2004)
- Individual innings: 400 not out (Brian Lara vs England, 2004)
- Individual match aggregate: 456 (Graham Gooch vs India, 1990)
- Individual sixes in an innings: 12 (Wasim Akram vs Zimbabwe, 1996)
- Individual fours in an innings: 52 (John Edrich vs New Zealand, 1965)
- Fastest 100-plus score: 110 in 58 (Viv Richards vs England, 1986)
- Slowest 100-plus score: 104 in 422 (Sanjay Manjrekar vs Zimbabwe, 1992)
- Most wickets in an innings: 10 (Jim Laker, Anil Kumble, Ajaz Patel)
- Most wickets in a Test: 19 (Laker vs Australia, 1956)
- Most dismissals by wicketkeeper in a match: 11 (Jack Russell, AB de Villiers, and Rishabh Pant)
- Most catches by a fielder in match: 8 (Ajinkya Rahane vs Sri Lanka, 2015)
- Partnership records for each wicket
The two-innings farce of a Test in Centurion) and The Oval Test in 2006 that Pakistan forfeited to England, are allotted TQI values of 1.
These complex algorithms are entered into the program which determines final TQI determination. It is a mix of objective and subjective tenets.
Now let us move on to some key insights that can be derived using the TQI values.
In the first table, I take a look at the best years of Test cricket based on the average TQI for the year.
The best year happens to be the year that just passed by: 2023 has an imposing TQI average of 6.50. That is higher than an average of a result in every Test. It hosted two level-10 Tests: The one-run win by New Zealand over England, and the WTC final. In addition, 2023 witnessed no fewer than six Tests with TQI values of eight or nine. The year 2018 saw an average TQI of 6.23, featuring a four-run win for New Zealand as the only level-10 Test. The year 2021 had a TQI average of 6.20 and is in third position. It had two level-10 Tests: West Indies' one-wicket win over Pakistan in Kingston and the WTC final, plus four other high-TQI Tests.
In the second table, I take a look at the worst years of Test cricket based on the average TQI for the year.
The year 1989 was a pretty bad one for Test cricket: nothing happened. The TQI average was a miserable 4.43. No Test rated seven or above. This despite a very strong West Indies team with many glittering stars. Quite inexplicable indeed. The second-worst year was 1964 with an average of around 4.6. India's two-wicket win over Australia in Mumbai was the only notable Test, having a TQI of nine. Next comes 1987 with a TQI average of 4.64. Pakistan's 16-run win over India in Bangalore (Sunil Gavaskar's 96 notwithstanding) and the nine-wicket-down draw in the Boxing Day Test were the redeeming features. Readers might have noticed that all the featured Tests are in the 40-odd years between 1947 and 1991.
In the next table, I take a look at the best series of Test cricket based on the average TQI for the series.
The best series ever was, unsurprisingly, the one between Australia and West Indies in 1960-61. The reasons are well known. A tie, a nine-wicket-down draw, and a two-wicket win tell the story. The average TQI for the series was an astounding 8.0. In second place, also with an average of 8.0 points, but in three Tests, comes the Richards-Imran duel of 1987-88 in West Indies. A two-wicket win for the home team and a pulsating nine-down draw contributed. The 1907-08 Ashes down under comes in next position with an average of 7.8 points. A two-wicket win for Australia, a one-wicket win for the visitors, and a 49-run win for the hosts in the last Test made this possible. For those interested, the 2005 Ashes just missed featuring, with a TQI average of 7.20.
In the next table, I take a look at the worst series in Test cricket based on the average TQI for the series.
Two pairs of teams share space on the worst series honours board with 2.67 points. Sri Lanka appear in both. In the series against Zimbabwe in 1994-95, there were three draws, one spanning two innings and the others, three innings. That no Test went to the fourth innings was a testament to the boredom quotient. Sixteen years later, at home, Sri Lanka played out three draws against West Indies, managing to reach the fourth innings only once. Bracketed at an average TQI of 3.00 are six series, with Pakistan featuring in no fewer than four of these.
In the next table, I take a look at the best years of Test cricket based on the positive results achieved. The two ties are treated as results as far as this analysis is concerned.
The year 2019 is the best year as far as results are concerned. There were only four draws in 39 Tests. One of these draws was a very exciting one with Australia six wickets down in a low-scoring match. It is followed closely by 2018, with 43 results achieved in 48 Tests. This time, two of the five draws were cliffhangers with teams being eight down in the fourth innings. The turbulent 2020 follows next. Despite the Covid situation, 19 of the 22 Tests were decisive. Readers can marvel at the profusion of the years between 2010 and 2023 in this table.
In the last table, I take a look at the worst years of Test cricket based on the positive results achieved.
Now for those dreaded years in which safety-first tactics were applied: 1964 saw just six of the 24 Tests being decisive. This was indeed terrible. And given that it was my first year of serious cricket-watching, it is a surprise that I did not tune off. Maybe my youth and naivety made me think five-day Test cricket had to be played over five full days. The year 1971 saw six Tests out of 17 being decisive. And one must say that two out of these 17 were completely unexpected wins by India, over West Indies and England. In 1987, despite the presence of a strong West Indies team, only nine out of 25 Tests finished decisively. Against West Indies, teams studiously employed the draw-at-all-costs policy.
The best team match-ups
Finally, a special piece of analysis. As far as TQI is concerned, the individual teams have really no relevance since the TQI considers only a result and not specifically a win or loss. However, the team-pairs have a relevance. Hence I have done two sets of analyses here. My sincere thanks to S Rajesh of ESPNcricinfo for suggesting this line of analysis.
Finally, a special piece of analysis. As far as TQI is concerned, the individual teams have really no relevance since the TQI considers only a result and not specifically a win or loss. However, the team-pairs have a relevance. Hence I have done two sets of analyses here. My sincere thanks to S Rajesh of ESPNcricinfo for suggesting this line of analysis.
The first is to consider the team pairs for the period 2000-2023. The best pairing here is West Indies-Pakistan. In the 20 Tests they have played with each other, they have an average TQI of 6.3. The next best pairing is Australia-Pakistan. In their 26 Tests, they have an average TQI of 6.27. The third best pairing is Australia-England, averaging 6.2 in their 65 Tests. The lowest average TQI is for India-Pakistan, 5.08 from 12 Tests.
The second analysis segment is done while considering the team pairs for the period 1877-2023. The best pairing here is Australia-West Indies. In the 118 Tests they have played, they have an average TQI of 6.09. This is the only pair to have exceeded six. The next best pairing is West Indies-Pakistan, averaging 5.91 from 54 Tests. In third place is the Australia-India pair, averaging 5.87 from 107 Tests. The lowest average TQI is for India-Pakistan, 4.46 from 59 Tests - the only pair to have an average below five. All those five-draws Test series between the two coming home to roost.
Winning after falling behind
From August 2023 onwards I added a bonus section to my column in which I present a numerical/anecdotal outlier relating to Test and ODI cricket. This time:
From August 2023 onwards I added a bonus section to my column in which I present a numerical/anecdotal outlier relating to Test and ODI cricket. This time:
Four teams have won after being asked to follow on, one as recently as 2023, but how many have won after conceding a deficit of over 200 runs and not following on?
Well, the answers are here. It is truly amazing that Australia were the unlikely winners in all three Tests featured below.
1. This was the famous Neil Harvey match. In January 1950, in Durban, South Africa scored 311 and then dismissed Australia for 75, but didn't enforce the follow-on. However they were dismissed for 99 in their second innings, Ian Johnson and Bill Johnston sharing nine wickets. Chasing 336, Australia slipped to 95 for 4 but Harvey's all-time great innings of 151 (seventh in my Bat100 list) took them to a famous five-wicket win.
2. In Colombo in 1992, Australia managed 256, after fighting back from 124 for 7. Aided by three centuries, Sri Lanka scored 547. Everyone contributed in Australia's second innings to reach a substantial 471. A successful chase of a low target of 181 was on the cards when Sri Lanka reached 127 for 2. Then offspinner Greg Mathews picked up three wickets and Shane Warne ripped out the late order to give Australia an unlikely win by 16 runs.
3. We move forward 18 years to the SCG, in 2010. Mohammad Asif bundled out Australia for 127 and Pakistan took a seemingly unassailable 200-plus-run lead. Michael Hussey held the Australian second innings together with an unbeaten 134 but the target of 176 was still below par. However, Pakistan folded for 139, falling to the wiles of Nathan Hauritz and pace of Mitchell Johnson.
Talking Cricket Group
Any reader who wishes to join my general-purpose cricket-ideas-exchange group of this name can email me a request for inclusion, providing their name, place of residence, and what they do.
Any reader who wishes to join my general-purpose cricket-ideas-exchange group of this name can email me a request for inclusion, providing their name, place of residence, and what they do.
Email me your comments and I will respond. This email id is to be used only for sending in comments. Please note that readers whose emails are derogatory to the author or any player will be permanently blocked from sending in any feedback in future.
Anantha Narayanan has written for ESPNcricinfo and CastrolCricket and worked with a number of companies on their cricket performance ratings-related systems