How to pick the best Test batting performances of all time
Breaking down the method involved to come up with a rankings list
Anantha Narayanan
20-May-2023
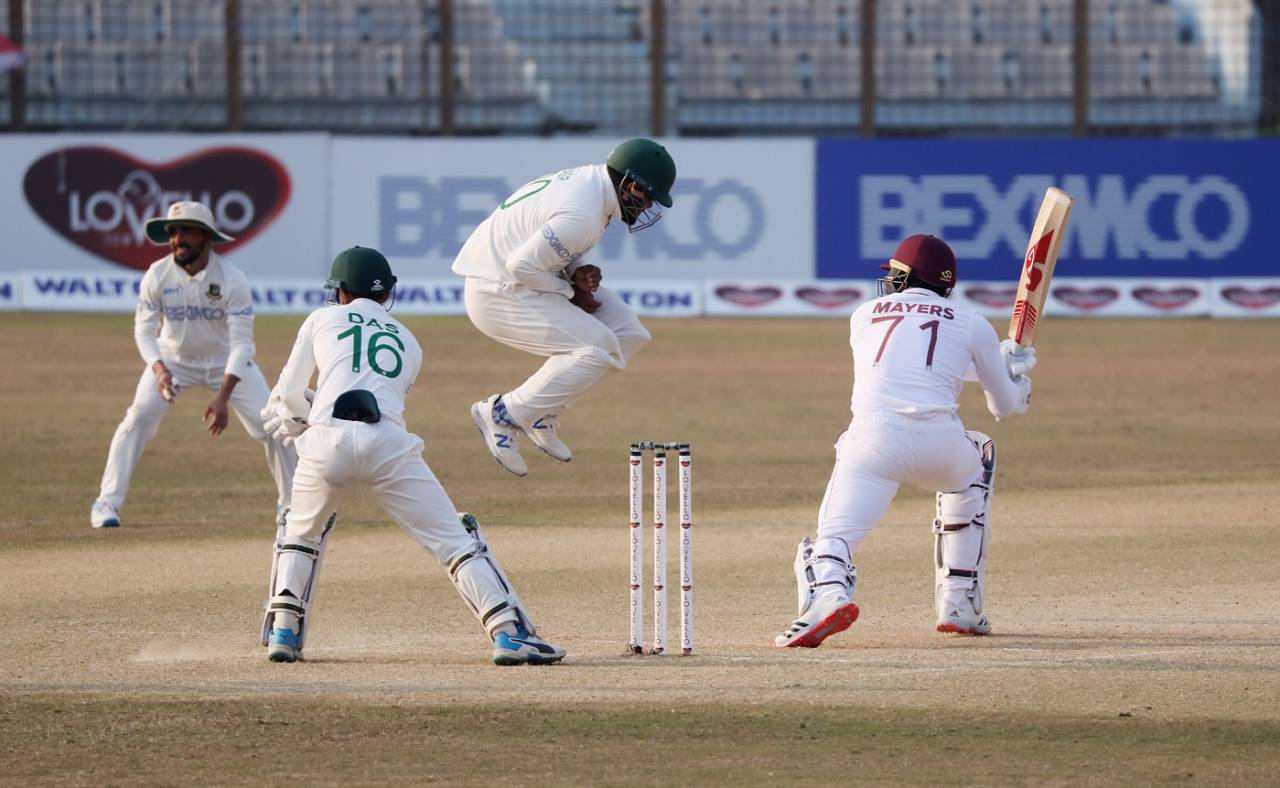
The last few years have produced a number of exciting performances, like Kyle Mayers' 210 not out in Chattogram, that demands a relook at the list • BCB
This is a 360-degree revision of the historic and epochal Wisden top 100 batting performances released in 2001, and the completely revised version, called Golden Willow 25, released on ESPNcricinfo in 2018. During these 22 years, there have been many insights, suggestions, data revelations and a far better understanding of this unique concept. In 2001, we had six months to get it done. Now, we have had over two decades. This is a new Bat-100 table, incorporating many improvements - conceptually, contextually, and by factors taken into account - in breadth and depth.
The basic idea remains the same - a bouquet of the 100 best Test batting performances ever. The new list is as exciting as the first one, since there have been many wonderful performances in the past 20 years - no fewer than 36 of the 100. We saw a virtual repeat of Bridgetown 1999, 20 years later in Durban. We saw an action-replay of an all-time classic at Headingley, 38 years after the first one. We have had a debutant play an innings of a lifetime - no, multiple lifetimes - in his first Test in Chattogram. And so on.
This note explains the current model and the related background information.
Methodology
In 2001, the work I did was as a single run-through in a common process across all innings. In 2018, I improved that concept significantly, but followed a similar model. The most important thing I have learnt during the two decades is that the four innings vary considerably, and that I would be well-advised to do the whole process for each innings separately. The parameters vary significantly across the innings and the strategies used are chalk and cheese. The batters change their playing strategies drastically across four innings.
In 2001, the work I did was as a single run-through in a common process across all innings. In 2018, I improved that concept significantly, but followed a similar model. The most important thing I have learnt during the two decades is that the four innings vary considerably, and that I would be well-advised to do the whole process for each innings separately. The parameters vary significantly across the innings and the strategies used are chalk and cheese. The batters change their playing strategies drastically across four innings.
The first and second innings are somewhat similar, with minor variations. The first batting team, with nothing in the match to guide them, aims for a defined target. This target has varied considerably across the years but can be determined with reasonable accuracy. The team batting second has an innings to go by. They have more information to plan their innings and aim for a potentially match-winning or match-saving total. They have to be practical and need to have their feet on the ground. Facing 150, they should aim for a relatively small lead. Facing 550, they should aim for a manageable deficit. As the table below indicates, in nearly 1200 Tests (50% of the total), the first-innings scores were below 300, and most of these are likely to be subpar scores, barring the 19th-century Tests. As such, in general, the second-innings batting efforts are likely to get less recognition.
The third innings is arguably the most complex of the lot. Leaving aside the matches in which one team has a 200-plus lead or deficit, which makes strategy wholly redundant, the other Tests present multiple conundrums. What target to set for the team batting last and how many overs to leave are quite difficult questions to solve, even for experienced captains. The first two innings scores provide a clear indication of the pitch: 150/150 and 400/400 situations have to be handled in two totally different ways. A fourth-innings target of 200 might suffice in the first case, while 350 may not be enough in the latter. And, often, the ability to call for a second new ball is a key factor.
The fourth innings is the simplest of all. The batting team has a single figure in front - the target to win. This ranges from 1 to 836 and is set in stone. The captains have clear targets: to go for a win or play out the overs for a draw. The overs still remaining form an important consideration. Hence I now do everything separately, by innings.
In view of their similarities, I combined the first and second innings together and ran a common process, identifying and handling a few differing situations, mainly target-related, within the process. Then I worked on the third and fourth innings independently. I got the interim ratings points, out of a maximum of 100, summarised the values across the four innings, and studied various statistical parameters - mean, distribution, minimum and maximum for each innings. Then I applied multiplying factors for each innings that vary by around 5% among them, to derive a final Bat-100 value. The numbers are fixed in such a manner that a Bat-100 rating points of 1000 - the ultimate performance - would almost certainly never be reached.
The whole process is quite complex and cannot be explained in its entirety without program codes, however, I have tried to give an overall blueprint of the whole system here.
Multiplicative vs Additive
Each innings is valued on 14 parameters. There are two ways to achieve the final ratings values. One is to take a base parameter such as "runs scored", assign a base point value to it, determine the multiplicative factor for each of the 14 parameters and multiply the base value by these indices. I have adopted that approach for my real value of runs work, since the base parameter was clearly defined. And I was ready to accept that an innings of 100 might be valued at 120 and a total of 340 at 270. The first is a positive innings and the second a negative one. What was important was not the absolute value but the percentage increase or decrease.
Each innings is valued on 14 parameters. There are two ways to achieve the final ratings values. One is to take a base parameter such as "runs scored", assign a base point value to it, determine the multiplicative factor for each of the 14 parameters and multiply the base value by these indices. I have adopted that approach for my real value of runs work, since the base parameter was clearly defined. And I was ready to accept that an innings of 100 might be valued at 120 and a total of 340 at 270. The first is a positive innings and the second a negative one. What was important was not the absolute value but the percentage increase or decrease.
However, the ratings process is totally different. A 97 by Gundappa Viswanath should have as good a chance as a 154 by Graham Gooch or a 262 by Dennis Amiss, to be ranked comparably. In other words, it should be possible for the 97 to receive around 750 rating points, the 154, 850 rating points and the 262, 800 points. This can never be achieved in a multiplicative process. The high value of 400 would trump everything else. Similarly, the low value of 97 would prevent it from getting its true worth. Hence I have kept runs scored as nothing more than a single parameter, with reasonable weight, and assigned the other parameters values and performed an additive process.
Parameter weights
Some sceptics might question the concept of parametrisation of an innings. I have always stood by that method as the fairest one to determine the value of an innings. And it has worked very well when one considers the final results. Not one of the top 25 innings is out of place.
Some sceptics might question the concept of parametrisation of an innings. I have always stood by that method as the fairest one to determine the value of an innings. And it has worked very well when one considers the final results. Not one of the top 25 innings is out of place.
The only subjective elements that are present in this process are the weights. However, my quarter-century of cricket analysis has helped me to arrive at the weights in an informed and fair manner. My extensive knowledge of almost all the top innings that have been played and many trial runs have helped me work out very fair parameter weights. There have been lots of to-and-fro processes to validate the weights. I also use statistical measures extensively to validate the values.
The most significant change has been that the runs scored has only a 10% weight. This has allowed no fewer than 11 sub-100 innings to be featured in the top-100 table. Scoring big is not enough to get featured. Only a third of the Bat-100 innings are in excess of 200. And only eight of the 31 triple-hundreds have found a place in the Bat-100. Similarly, the weight for wins has also been kept at around the sub-10 level. This has allowed quite a few innings in drawn and lost matches to reach the top echelons. Eighteen innings played in drawn matches and five innings played in lost matches are in the Bat-100.
Now let us move on to the parameters, their weights and examples.
Rating parameters: batter related
1. Runs scored (10 pts)
Runs scored is a straightforward parameter, however, there is a major shift in the way I have allocated points. Previously every innings was evaluated based on the 400. Now, the base high-score values for allotting maximum points vary from innings to innings and period to period. This is required because the highest score reached in the first period was only 287 while in the sixth period it was 400. And within a single period, the highest scores reached in the four innings vary wildly. The table below gives the base values. The appropriate value, out of the 28 values, will be used as the base.
Runs scored is a straightforward parameter, however, there is a major shift in the way I have allocated points. Previously every innings was evaluated based on the 400. Now, the base high-score values for allotting maximum points vary from innings to innings and period to period. This is required because the highest score reached in the first period was only 287 while in the sixth period it was 400. And within a single period, the highest scores reached in the four innings vary wildly. The table below gives the base values. The appropriate value, out of the 28 values, will be used as the base.
Kyle Mayers' 210 in the fourth innings in Chattogram secures the maximum of 10.0 points since he was the top scorer in the 2011-2023 fourth-innings group. Virender Sehwag, on the other hand, secures only 7.73 points for his 309, since the 2001-2010 first-innings group had a highest score of 400. Jack Hobbs' 187 in an era in which the highest score was only 211, receives 8.86 points.
2. Scoring rate (3.5 pts)
This parameter has become more significant over the past few years with a marked change in teams' views that scoring quicker means having more time to win Tests. However, this parameter should be viewed in conjunction with the next one - balls faced.
This parameter has become more significant over the past few years with a marked change in teams' views that scoring quicker means having more time to win Tests. However, this parameter should be viewed in conjunction with the next one - balls faced.
The maximum allocation is for scoring rates of 150 or more. I have not used the period/innings method since I really want to reward the batters who did something radically different.
3. Balls faced (2.5 pts)
This parameter becomes important so as to recognise the match-saving innings played in the latter two phases of a Test. There is a fundamental dichotomy here. Out of the nearly 89,000 innings in Test matches so far, around 22,000 or so do not have balls-played information. So I extrapolate balls played using the team scoring rates for these.
This parameter becomes important so as to recognise the match-saving innings played in the latter two phases of a Test. There is a fundamental dichotomy here. Out of the nearly 89,000 innings in Test matches so far, around 22,000 or so do not have balls-played information. So I extrapolate balls played using the team scoring rates for these.
Balls faced is further complicated by the fact that the base values for allotting maximum points vary from innings to innings and period to period. The table below gives the base values. The appropriate value, out of the 28, will be used as the base.
Working of scoring-rate and balls-played measures
Let me now explain the way these two measures are used in a juxtaposed manner.
Let me now explain the way these two measures are used in a juxtaposed manner.
In the first two innings, the two parameters are used independently and are assigned their individual values. It is difficult to make a proper determination of whether it is more important to score reasonably quickly or play long innings. Scoring quickly does not always lead a team to a win.
However, in the third and fourth innings, the role of these two parameters begins to be more clearly defined. Even here, it is not very easy to say that one is more important than the other and many a time there is an overlap. In general, one could say that the innings with high scoring-rates win matches (Jonny Bairstow at Edgbaston) and the long-haul innings save matches (Amiss in Kingston). Hence I have adopted a Solomonic solution.
I do the following computations and I select the one combination that will offer the batter maximum points. I think this neat dual-parameter trick is the best new introduction of mine in this exercise.
6.0 points for scoring rate and 0 points for balls played
3.5 points for scoring rate and 2.5 points for balls played
0 points for scoring rate and 6.0 points for balls played
3.5 points for scoring rate and 2.5 points for balls played
0 points for scoring rate and 6.0 points for balls played
Sehwag's 201 in 231 balls in the first innings in Galle fetched 2.03 and 0.99 points respectively for these two parameters. Nathan Astle's 222 off 168 balls in Christchurch fetched 5.29 points in total, all for his fantastic strike rate. Amiss got 5.53 points, all points assigned to balls played, for his match-saving innings of 262 in 563 balls in Kingston.
4. Late-order runs (5 pts)
Runs added with the late order are gold, and may make the difference between a loss and win. I determine the runs the concerned batter added with late-order batters after the fall of the sixth wicket, get the proportion of these runs in the final team score, and allot the points. Since the batting average for Nos. 8-11 varies considerably across the years, this factor is built into the late-order-runs calculations - after all, it is easier to add 90 for the last four wickets with a quartet averaging 18 than one that averages eight.
Runs added with the late order are gold, and may make the difference between a loss and win. I determine the runs the concerned batter added with late-order batters after the fall of the sixth wicket, get the proportion of these runs in the final team score, and allot the points. Since the batting average for Nos. 8-11 varies considerably across the years, this factor is built into the late-order-runs calculations - after all, it is easier to add 90 for the last four wickets with a quartet averaging 18 than one that averages eight.
A late-order runs share of 80% is the maximum allocation, since very few late-order accumulations are over that figure.
Clem Hill, while scoring a terrific 188 at the MCG against England in 1898, added 245 (out of a team total of 323 runs) for wickets 7 to 9, and secured 4.65 points.
5. Batter tenure at crease (5 pts)
This measure is to reward the batters who stay at the crease and build partnerships. The key aspect is the number of partnerships that a batter was part of and the runs the team adds while the batter was at the crease. The best example is that of an opening batter who carries his bat. During his tenure, ten partnerships have been essayed and 100% of the team runs were added.
This measure is to reward the batters who stay at the crease and build partnerships. The key aspect is the number of partnerships that a batter was part of and the runs the team adds while the batter was at the crease. The best example is that of an opening batter who carries his bat. During his tenure, ten partnerships have been essayed and 100% of the team runs were added.
A maximum of 3.0 points are allocated for participating in ten partnerships and 2.0 points for 100% of team runs.
Mahela Jayawardene, during his innings of 180 against England in Galle in 2012, secured 4.5 points. He came in at 11 for 2 and was last out at 318. Yes, I understand, this favours the top-order batters, but then they deserve the recognition, don't they?
Rating parameters: Other batters
6. Support received - High Scoring Index (HSI) (8 pts)
HSI is a measure used to define the support received by a batter. It is a comprehensive measure defining where the batter's innings stands on the innings totem pole. The maximum allocation is for a HSI of 5.0. Only Charles Bannerman has an HSI greater than 5.0 and his HSI is fixed at 5.0.
HSI is a measure used to define the support received by a batter. It is a comprehensive measure defining where the batter's innings stands on the innings totem pole. The maximum allocation is for a HSI of 5.0. Only Charles Bannerman has an HSI greater than 5.0 and his HSI is fixed at 5.0.
Bannerman received 8.0 points for his very high HSI of 6.38 in the first innings of the first Test match, when he scored 165 out of 245. VVS Laxman got an HSI rating value of only 1.02 points for his 281, since he received excellent support from Dravid.
7. Peer comparisons - Innings Peer Value (IPV) (8 pts)
The IPV is a measure used to identify where the batter's score is placed with reference to the other scores for the team, and additionally, the other scores in the match. The IPV measure is determined by calculating the IPV-T (IPV-Team) and IPV-M (IPV-Match) values and adding those.
The IPV is a measure used to identify where the batter's score is placed with reference to the other scores for the team, and additionally, the other scores in the match. The IPV measure is determined by calculating the IPV-T (IPV-Team) and IPV-M (IPV-Match) values and adding those.
The IPV-T, being the more important measure, carries a weight of 5.0 points and the IPV-M measure, 3.0 points.
Wally Hammond's 336 not out in Auckland in 1933, a very dominant innings, secured 6.36 points for his high IPL-T and IPV-M values.
Rating parameters: Bowling/pitch
8. Bowling quality faced + bowler experience (12.5 pts)
The bowling quality is determined by looking at the four best bowlers from the bowling team and averaging their career-to-date location bowling averages. The location split is only home-away, and not specific to each country. Thus the relevant numbers come into the picture. In addition, the recent form is incorporated by giving 25% weight to the bowling average in the last ten Tests played by the bowler, across locations. This is allotted ten points.
The bowling quality is determined by looking at the four best bowlers from the bowling team and averaging their career-to-date location bowling averages. The location split is only home-away, and not specific to each country. Thus the relevant numbers come into the picture. In addition, the recent form is incorporated by giving 25% weight to the bowling average in the last ten Tests played by the bowler, across locations. This is allotted ten points.
In addition, I look into the bowling experience the batter faces and assign 2.5 points for that. This value is a sum of the career-to-date wickets taken by the bowlers. Let's face it: it was much easier facing an attack with 137 wickets between them, as India's batters faced at Lord's in 2007, than the 1554-wicket attack that the England batters faced in Sydney earlier that year.
Kusal Perera faced a devastating bowling attack during his once-in-a-century innings of 153 not out in Durban. His innings received a BowQ value of 11.4 points.
9. Nature of Pitch - Last ten years' Pitch Performance (L10PP) + PQI (12.5 pts)
This intricate measure is used to assess the quality of the pitch. This is compiled in two steps. The first is based on the last ten years' average Runs-per-Wicket (RpW) for the pitch. The previous five years' values are given 100% weight and the earlier five years 50% weight. The limits of 50 and 15 are fixed for this average RpW value, which is called L10PP.
The second part relates to how the pitch has behaved in the current match. This is based on a complex measure called Pitch Quality Index (PQI). For the first two innings, PQI-12 (values in the first two innings) is used, while, for the latter two innings, PQI-34 (values in the last two innings) is used. Matches which do not get into the fourth innings have only single PQI values.
The L10PP parameter gets a 6.25 points allocation and the PQI a 6.25 points allocation.
Len Hutton's magnificent 62 not out, in the diabolic Brisbane glue pot in 1950, received a high PQI measure value of 11.0 points. The pitch was a tough one with a L10PP value of 25.0. The PQI-34 was a very low 15.8. Unfortunately, this was a brave innings in a losing cause.
Rating parameters: Innings status and result
I thought long and hard about the series situation. It is very clear that many matches in the years gone by have been treated lightly because of the dead-rubber syndrome. However, currently, with the priority given to WTC and the consequent importance accorded to all the Tests in the tournament, it is very difficult to say that an innings played in a 3-1 situation should be treated at a lower level than one played in a 1-1 situation - whether in 1948 or 1985 or 2022. Hence, I have let the series situation go.
10. Innings status at entry (8 pts)
The innings status at entry measure depends on the target in front, the team score and wickets lost at entry. The determination of the target is innings-dependent. Theoretically the innings status can move from very difficult (say, if the target is 400 and the batter enters at 30 for 5) to extremely easy (the target is 100 and the batter enters at 90/2).
The innings status at entry measure depends on the target in front, the team score and wickets lost at entry. The determination of the target is innings-dependent. Theoretically the innings status can move from very difficult (say, if the target is 400 and the batter enters at 30 for 5) to extremely easy (the target is 100 and the batter enters at 90/2).
The maximum allocation is for a status of 100% (almost certain loss).
Neil Harvey, getting in at 59 for 3 while chasing a target of 336 in Durban in 1950, received an allocation of 7.84 points. The winning chance for Australia was only 2% at the time of Harvey's entry.
11. Location, result and team strength (10 pts)
This is a composite parameter incorporating the location, result and the relative-team-strength index. The three locations, home, neutral and away, and the three results, win, draw and loss, are combined to form a dual index, with a base value of between 0 and 5. Then the relative-team-strength index value, with a range of 0.33 to 2.97, is used to add a variable component. For the two tied matches, both teams are deemed to have won the Tests.
This is a composite parameter incorporating the location, result and the relative-team-strength index. The three locations, home, neutral and away, and the three results, win, draw and loss, are combined to form a dual index, with a base value of between 0 and 5. Then the relative-team-strength index value, with a range of 0.33 to 2.97, is used to add a variable component. For the two tied matches, both teams are deemed to have won the Tests.
A maximum of 10.0 points are allocated for this parameter. This allocation is for an away win by a team that is around three times as weak as the other team - say, a win by Afghanistan in Melbourne. In addition, a slight bonus is added for one-wicket wins (0.5 points) and two-wicket wins (0.2 points) in the fourth innings. This is to acknowledge the very few such occurrences (only 32) and the pressure on the batters at the crease at the end.
Rahmat Shah and Asghar Afghan, among others, who were part of Afghanistan's earth-shattering win over Bangladesh in Chattogram in 2019, secured the maximum of 9.3 points.
12. Winning margin (3.0 pts)
This is a contra-measure, in that a huge win margin results in allotment of zero points and a very narrow win the maximum points. This is to recognise the fact that the value of the innings is to be trimmed slightly where the win was huge and there are lots of slack runs available. Care is taken that the teams that win after being in arrears of more than 200 runs, which has happened only six times, are not penalised by this. This is applicable to all the innings since a win is fashioned by batters across both innings. A fascinating sub-plot to this is that the performances will lose whether there is a big win or a big defeat. Similarly, performances will gain whether there is a narrow win or a narrow loss.
This is a contra-measure, in that a huge win margin results in allotment of zero points and a very narrow win the maximum points. This is to recognise the fact that the value of the innings is to be trimmed slightly where the win was huge and there are lots of slack runs available. Care is taken that the teams that win after being in arrears of more than 200 runs, which has happened only six times, are not penalised by this. This is applicable to all the innings since a win is fashioned by batters across both innings. A fascinating sub-plot to this is that the performances will lose whether there is a big win or a big defeat. Similarly, performances will gain whether there is a narrow win or a narrow loss.
Rating parameters: Other factors
13a. Innings performance (9 pts: Inns 1-3)
This measure works in conjunction with the next one. For the first two innings, this is a straightforward comparison of the target and the actual score: to what extent did the team exceed or fall short of the target at the end of the innings determines how many points are available for the team. Those are, in turn, allotted to the batter, in proportion to their contributions.
This measure works in conjunction with the next one. For the first two innings, this is a straightforward comparison of the target and the actual score: to what extent did the team exceed or fall short of the target at the end of the innings determines how many points are available for the team. Those are, in turn, allotted to the batter, in proportion to their contributions.
The third innings is a special one. The team batting third carries with it a lead or deficit. Looking forward, a reasonable target has to be set for the fourth innings. There is a complex algorithm to evaluate the performance of the team, using these two sets of numbers.
Laxman's masterclass of 281 in Kolkata received a high share of 8.08 points since a very high third-innings target was achieved, and exceeded, with comfort.
13b. Win-percent change during batter's tenure at crease (9 pts: Inns 4)
It is an either-or situation between this parameter and the previous one. The innings performance parameter is used for the first three innings and the win-per change for the fourth innings. The best way to explain this measure is with a couple of examples.
It is an either-or situation between this parameter and the previous one. The innings performance parameter is used for the first three innings and the win-per change for the fourth innings. The best way to explain this measure is with a couple of examples.
The team batting fourth has a target of 450 and the win-per is 2%. The openers start with this value. A partnership of 100 results in the win-per moving up to 20%. The dismissed batter has a value of 18 (20-2). The No. 3 batter enters at 20%. They keep losing batters and the No. 3 batter is out 35 runs from the target and the win-per is 78%. His value is 58% (78-20). And so on. A fourth-innings target of 125 might have a starting win-per of 80%.
The maximum allocation is for a value of 100%, whether the innings performance is used or the win-per change is used.
Ben Stokes entered at 141 for 3 and a winning chance of 14% at Headingley against Australia. He stayed on till the end and this 86% move fetched him a win-per value of 7.74 points.
The next two are subjective factors based on many mails, conversations and insights that I have received over the years. In general, these facts relate to situations that cannot be identified or measured using individual scores, bringing into the equation the intangibles that define the innings. The three factors are identified below.
14a. The other team's form (3 pts: Inns 1-2)
The form of the opposing team is a significant factor when the team starts a match. A team that comes in with, say nine-ten wins on the trot, is going to be very tough to face. On the contrary, imagine facing a team that has lost eight of its last ten Tests. This factor is a clear and accurate depiction of the form the batters were against. A total of 30 points is the maximum (ten away wins). This factor is applicable only to the batters who bat in the first and second innings. By the time two innings are completed, the effects of this factor wear off and the current match situation takes over. The highest form index is that of the West Indian team at the MCG in 1984. They carried a value of 29.0 points, so the Australian batters are rewarded with 2.9 points.
The form of the opposing team is a significant factor when the team starts a match. A team that comes in with, say nine-ten wins on the trot, is going to be very tough to face. On the contrary, imagine facing a team that has lost eight of its last ten Tests. This factor is a clear and accurate depiction of the form the batters were against. A total of 30 points is the maximum (ten away wins). This factor is applicable only to the batters who bat in the first and second innings. By the time two innings are completed, the effects of this factor wear off and the current match situation takes over. The highest form index is that of the West Indian team at the MCG in 1984. They carried a value of 29.0 points, so the Australian batters are rewarded with 2.9 points.
14b. A win/draw after a huge deficit (3/1.5 pts: Inns 3-4)
In the third innings, it could be a follow-on or a normal innings. The numbers do not tell the full story. A 200-run deficit presents a far tougher mountain to climb. A combination of the deficit and result is used to assign points for this measure. This factor is applicable to the team batting in the third innings. This concerns the 31 matches that were won by teams with a deficit of 100 runs or more. And the 84 matches that were drawn by teams with a deficit of 200 runs or more, and batted for long periods.
In the third innings, it could be a follow-on or a normal innings. The numbers do not tell the full story. A 200-run deficit presents a far tougher mountain to climb. A combination of the deficit and result is used to assign points for this measure. This factor is applicable to the team batting in the third innings. This concerns the 31 matches that were won by teams with a deficit of 100 runs or more. And the 84 matches that were drawn by teams with a deficit of 200 runs or more, and batted for long periods.
Fourth-innings chases are really tough, especially the ones in which the targets are, say, 200-plus in run-scarce matches. As are fourth-innings saves in which many hours have to be seen through. A combination of the target and result is used to assign points for this measure. This factor is applicable to the team batting in the fourth innings. This concerns the 51 matches that were won by teams with a target of 200 runs or more. And the 70 matches drawn by teams playing out 100 or more overs.
A summary visual of all the parameters and their assigned weights is shown below. The graph is self-explanatory.
The main Bat-100 article will follow in two weeks' time in the lead up to the WTC final.
Talking Cricket Group
Any reader who wishes to join the general-purpose cricket-ideas-exchange group of this name that I started last year can email me a request for inclusion, providing their name, place of residence, and what they do.
Any reader who wishes to join the general-purpose cricket-ideas-exchange group of this name that I started last year can email me a request for inclusion, providing their name, place of residence, and what they do.
Email me your comments and I will respond. This email id is to be used only for sending in comments. Please note that readers whose emails are derogatory to the author or any player will be permanently blocked from sending in any feedback in future.
Anantha Narayanan has written for ESPNcricinfo and CastrolCricket and worked with a number of companies on their cricket performance ratings-related systems