How have first-innings numbers influenced the course of Tests?
Some teams have gone on to lose despite scoring big and others have bounced back from scores of as low as 45 to clinch wins
Anantha Narayanan
12-Nov-2022
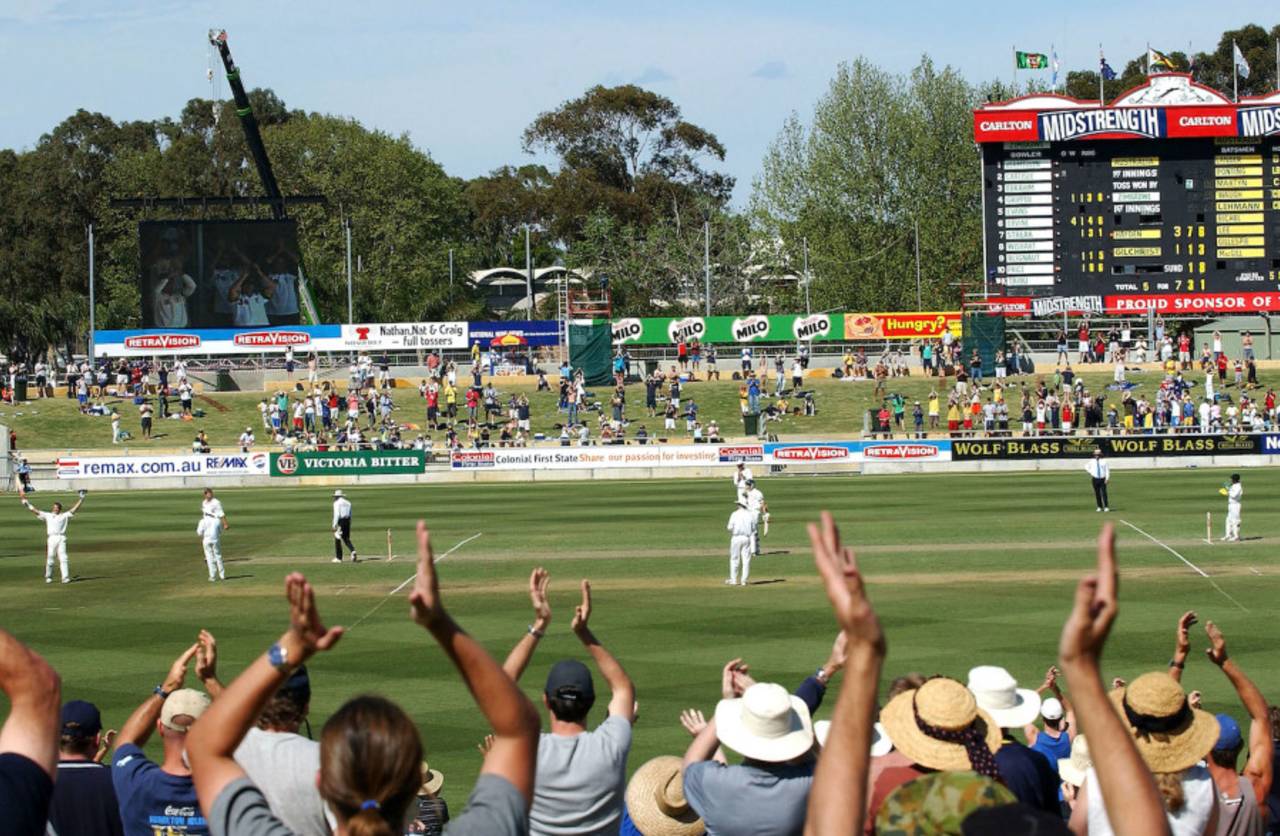
Only three teams have gone on to win Tests in which they scored 700 or more in the first innings, as Australia did against Zimbabwe in Perth in 2003 • Hamish Blair/Getty Images
Recently, an important realisation about Test cricket was brought home to me in the course of my work: the four innings in a Test are chalk, cheese, chalk, and cheese respectively. That insight has led to this, the first in a small series of articles that analyses Tests by innings.
The first innings is the one where teams play with no information other than data from past matches, and loads of hope. A captain who wins the toss and bats could be looking at 60-all-out by lunch. Another captain who wins the toss and puts the opposition in could go back to the hotel in the evening unable to look anybody in the eye, with the scoreboard at 300 for 2. One could call the first innings the launch-pad innings.
The second innings is reactive, and the reaction depends on what has the team batting first has scored. The response plan to a first-innings total of 100 may not be the same as it is to one of 350, or to 650 for 5. The need of the hour might well be 250, 350 and 450 respectively, for the three first innings listed above. But with the first-innings data available to the captain, his target can be determined based on available data.
The third innings is by far the most complex. Since two innings have been completed, the team batting third is doing so with either a deficit or lead. The characteristics of the pitch are known. The team has to decide on the sort of target that has to be set, and how many overs they have to leave on the table, if they have the opportunity to do so. It could be termed the setting-up innings.
The fourth innings is the clearest of all innings and the definitive one. The target is available as a clear and unambiguous number, that has ranged from 1 to 836. Alternatively, there is a target for the batting team to play for a draw.
Leaving aside the decision after winning the toss, which is the captain's prerogative, the team batting first has to start their innings with a clear target in mind. Until recently, I have worked on very general methods to determine the targets for the first innings. By far the best I have done is go by the average first-innings scores achieved in a predetermined period. However, I am aware that this is wholly inadequate, since it dumps data for a couple of decades together and treats Dunedin, The Oval, and Nagpur at par. This is an average that does not mean much.
The First Innings Target (FIT) is quite a complex one. We are talking about 145 years of Test cricket, over 130 grounds, across five continents and 15 countries. And for a match in which not a single ball has been bowled. As such, I have worked out a fairly complex method to determine the FIT, in five logical steps. It is briefly described below. This procedure is applied for each Test.
Grd_6Y: If six or more Tests have been played on the ground in the six years prior to the current Test, the average Runs per Wicket (RpW) for these Tests multiplied by 10 is determined to be the FIT. A total of 712 Tests fall under this category.
Grd_10Y: If fewer than six Tests have been played on the ground during the six years prior to the current Test, the period under consideration is extended to ten years. If six or more Tests have been played on the ground during these ten years, the average RpW for these Tests multiplied by 10 is determined to be the FIT. A total of 698 Tests fall under this category.
Cty_6Y: If fewer than six Tests have been played on the ground during the ten years previous to the Test in question, the scope of locations under consideration is extended to the entire country in which the ground is located. If ten or more Tests have been played in the country during the six years previous, the average RpW for these Tests multiplied by 10 is determined to be the FIT; 733 Tests fall under this category.
Cty_10Y: If fewer than ten Tests have been played in the country in the six years previous, the period under consideration is extended to ten years. If ten or more Tests have been played in the country during these ten years, the average RpW for these Tests multiplied by 10 is determined to be the FIT; 136 Tests fall under this category.
Period_Ave: This leaves us with 197 Tests for which there is no valid data even considering the entire country and covering a period of ten years. This could be due to the sparseness of Test cricket at the start of its history, the start of a team's playing career, World War I, World War II, the apartheid-era isolation of South Africa, blanking off of Pakistan home Tests for a few years, Zimbabwe being off the radar for six years, and so on. For these Tests, the average RpW for the appropriate period multiplied by 10 is used as the FIT.
Finally, a normalising tweak: 115 FIT values that are greater than 450 are brought down to 450, and 13 FIT values that are below 200 are brought up to 200.
Let us now move on to understand the first innings better. The tables below are current up to and including the third Test at The Oval between England and South Africa. First, something simple most of you will be familiar with - a list of high and low scores in the first innings, with some additional information thrown in. Of this, the FIR column provides the First Innings Ratio values. This is the ratio between the first-innings score and First Innings Target. It is an excellent indicator of Team Performance and is used in many analytical situations.
These are well-known numbers. However, certain things are striking. Scoring big does not necessarily lead to a victory. Seven teams have made over 700 in their first innings, but only three of those totals have resulted in a win for the team batting first. The benign nature of the pitch is obvious in such instances and these scores lead to dull draws, although the Antigua match in which Brian Lara made 400 nearly produced a result. The first four such matches each had an individual triple-hundred in the first innings.
At the other end, it is as expected. If you score below 50 in the first innings, you are going to lose big. Except in 1887, when England converted their 45 into a match-winning total. More on this Test later.
Of the 2476 Tests played so far, four were abandoned with fewer than 20 overs bowled. In the other 2472 Tests, the highest FIR was in Perth in 2003, where Australia scored 735 against a target of 237, resulting in an FIR of 3.10. The lowest FIR was in Melbourne in 1932), in which South Africa scored 36 against a target of 393, resulting in an FIR of 0.09. The table above lists the high-FIR and low-FIR Tests. Not all high-scoring Tests feature here, since the targets were correspondingly high in them. It is interesting to note that most teams won when the FIR was high and all teams lost when the target was low. A different scenario to the high- and low-scores table.
The next table shows a collection of wholly unexpected Test results, based on first-innings scores. Normally when a team bats first and scores in excess of 500, they do not expect to lose. And if a team does not even reach 100, the expectation is a big loss. In this table we will see matches in which those expectations were shattered.
Bangladesh scored nearly 600 in Wellington in 2017, conceded over 500, batted poorly again, and promptly lost. In the famous Sydney Ashes Test of 1894, Australia scored big, dismissed England cheaply, enforced the follow-on, and missed the final target narrowly - one of the greatest turnarounds ever. India matched Australia's first-innings score in Adelaide in 2003, Ajit Agarkar had his day, and India chased a low total fairly comfortably. England repeated the sequence in these Tests against New Zealand recently. And in four other Tests, first-innings totals exceeding 500 were overcome with wins. A feature of these matches is that, barring the odd game, the wins have been quite comfortable ones.
Now for the other end of the spectrum. England scored 45 in Sydney in 1887, then conceded a deficit of 75, set Australia a low target of 111 and won narrowly by 13 runs. One of the greatest revival stories ever. The next match is somewhat similar - this is the famous match that gave birth to the "Ashes" name. This time Australia did the impossible, winning by seven runs.
The two modern matches on the table are from the last decade. England, playing at Lord's in 2019, were shocked by Ireland for a paltry total of 85, and conceded a deficit of 122. Then they batted competently and decimated Ireland the second time around for 38. In Dubai in 2012, Pakistan scored 99, conceded a small deficit, batted very well in their second innings, and then bowled competently to carve out a comfortable win.
If the table above is redone with the FIR value as the selection criterion, more or less the same set of matches appears, so that table is not displayed.
Now we move on to the duration of the first innings. The top four entries in the table above are matches in which the team batting first batted around three days; below those are five instances of teams not lasting until lunch on the first day.
Though 335 overs were bowled in the first innings at The Oval in 1938, they were bowled at breakneck pace and in just over 15 hours. So England forced a result. The other matches in which over 250 overs were bowled all ended in dull draws, barring the Durban match of 1939, which had to be halted to allow England to catch the boat home. (Note here that the overs have been rationalised to six-ball overs.)
At the other end of the spectrum, as expected, the teams that did not last until lunch all ended losing heavily. The shortest first innings on record is that of the 2015 Australians, who were Broad-sided for 60 in less than 20 overs at Trent Bridge. Something similar happened with Bangladesh three years later. Their innings lasted one ball longer than the Australia one in that Ashes match. The last match is interesting. since India capitulated at home to the South African pace attack and lasted exactly 20 overs. The moral: if you bat first, at least see it through to lunch.
Now for a look at cases of teams who were sitting very well in their first innings and then slid to unexpected losses. In 2006 in Adelaide, England were on 468 for 3 on the second day, and subsequently moved on to 551, but then conceded over 500 runs and then were blasted away for 129, losing the match comfortably. At Headingley in 1948, England scored 496, secured a small lead and set Australia 404 to win - which they did, making a mockery of the target, thanks to Arthur Morris and Don Bradman.
There are four other instances of teams reaching 350-plus for 3 in their first innings, only to go on and lose.
In 1999 in Hamilton, West Indies, after being 276 for no loss, could only score 365 and lost the Test. In 2003, Bangladesh slid to 361 all out, from a position of strength at 310 for 2 against Pakistan, and lost the Test. A similar fate befell India later that year. Virender Sehwag's quick 195 was terminated when he went for a six. Also terminated were India's chances. They folded for 366, conceded a big first-innings deficit and lost by a big margin.
One thing common in almost all these matches is the sharp contrast in the way the losing teams folded in their second innings.
Now to the other extreme: teams who had horror starts and were looking at doom at lunch on the first day, but still went on to win. The first match has featured elsewhere in this article. England, from 17 for 6, reached the lofty heights of 45 and went on to win. Over 100 years later, in Calcutta in 1999, Pakistan were at 26 for 6 but recovered to reach 185, which, along with Saeed Anwar's all-time classic of 188 not out in the second innings, was enough to secure a great win for them. In Dubai in 2012, Pakistan recovered from 21 for 5 and got to 99, after which two centuries in their second innings led to a comfortable win.
Pakistan seem to specialise in such situations. Way back in 1959 in Dacca, Pakistan recovered from 22 for 5 to 145, which was enough to give them a lead and a comfortable win. Against India in 2006, Pakistan slid to 13 for 4 and recovered thanks to a Kamran Akmal masterclass. England in 1979, and New Zealand in 2002, recovered from poor starts through much better second innings.
Onwards to a trio of tables which emphasise the team results after batting first. I have compiled these by period, team and regions.
In the first one, above, the win-draw-loss record of the teams that batted first is portrayed, by period. The average target score has been 330 and above for the latter six periods, while it was 271 in the first period. This is understandable considering the low scores in the first period. This is confirmed by the average first-innings score of 262. In the other six periods the average value is around 340. The period in between the wars had a high average of 338, which was matched by the last two periods.
When we come to the percentage of teams that won batting first, this is somewhat high, at 49%, in the first period. Again, understandable because of the uncovered pitches and timeless Tests. This value then dropped to around 35% in the next period and has remained there until the last period, when it went up to 47%. There is a huge surprise when we compare the two periods of the 21st century. The win percentage was 35 in the first decade and moved up to 47 in the second decade. This is a surprise since the perception is that the win percent is quite high this century, and the first decade had a very powerful Australian team. I decided to look into it further and unearthed some revealing information. This is explained below.
The following numbers refer to the first innings in the 2000s.
- New Zealand: 43 matches and 10 wins (23%)
- Zimbabwe: 24 matches and 2 wins (8%)
- Bangladesh: 44 matches and 2 wins (5%)
- All three teams together - 13%
- Other teams: 396 matches and 162 wins (41%)
The following numbers refer to the first innings in the 2010s.
- New Zealand: 48 matches and 22 wins (46%)
- Zimbabwe: 16 matches and 4 wins (25%)
- Bangladesh: 34 matches and 9 wins (26%)
- All three teams together - 36%
- Other teams: 391 matches and 196 wins (50%)
The new teams, Zimbabwe and Bangladesh, and to a lesser extent, a weak New Zealand, did very little of note in the first decade. However, they improved in the second and started winning relatively more matches batting first. And the other teams also improved. The net impact is an increase from 35% in the first decade to 47% in the second decade.
Now for a look at the first-innings performance of teams. Australia never cease to amaze whichever way we look at them. When they batted first, they won 50% of their Tests. The magnitude of this achievement is apparent only when we see that other teams win less than a third of matches in which they bat first. And Australia lost just under a quarter of their matches batting first. Their average first-innings score is around 20 runs higher than the best of the rest, and they have an average FIR value of 1.19. These are values across 15 decades. If you look at the period 2000-2020, Australia's figures are mind-boggling; they have won 63.5% of matches in which they batted first (80 out of 126).
South Africa, mainly bolstered by their performance over the last two decades, have won 41% of their matches when batting first. England are placed well at 38%, and India at 34%. However, India have a relatively high drawn-games percentage of 37 (a result of those days in the 1960s through the '80s when saving matches was very important). West Indies, thanks to their magnificent teams in the '80s and '90s, are tied with India at 34%, as are Sri Lanka. Then come Pakistan, with a win percent of 30, but with a huge number of draws. Finally, New Zealand have a first-innings win percent of 24, a number boosted by their recent performances.
Finally a look at the way teams progressed batting first, ordered by the region in which the Tests were played.
In England and Ireland (just one match), 37% of matches resulted in wins. This is slightly ahead of the all-Tests value of 36%. Australia-New Zealand produced wins for teams batting first in 39% of Tests played there; only 26% of matches in those countres ended in draws. West Indies and the Africas produced 36% wins. Finally, the Asian subcontinent produced only 32% wins for the team batting first, despite notions about pitches in Asia wearing towards the end of matches. However, there were 36% draws. The average target does not vary much nor does the average first-innings score.
Talking Cricket Group
Any reader who wishes to join the general-purpose cricket ideas exchange group of this name that I started last year can email me a request for inclusion, providing their name, place of residence, and what they do.
Any reader who wishes to join the general-purpose cricket ideas exchange group of this name that I started last year can email me a request for inclusion, providing their name, place of residence, and what they do.
Email me your comments and I will respond. This email id is to be used only for sending in comments. Please note that readers whose emails are derogatory to the author or any player will be permanently blocked from sending in any feedback in future.
Anantha Narayanan has written for ESPNcricinfo and CastrolCricket and worked with a number of companies on their cricket performance ratings-related systems