Everything you wanted to know about run rates in Test cricket
The lowest run rate for a winning team, the highest difference between scoring rates in the same Test, and more
Anantha Narayanan
07-Oct-2022
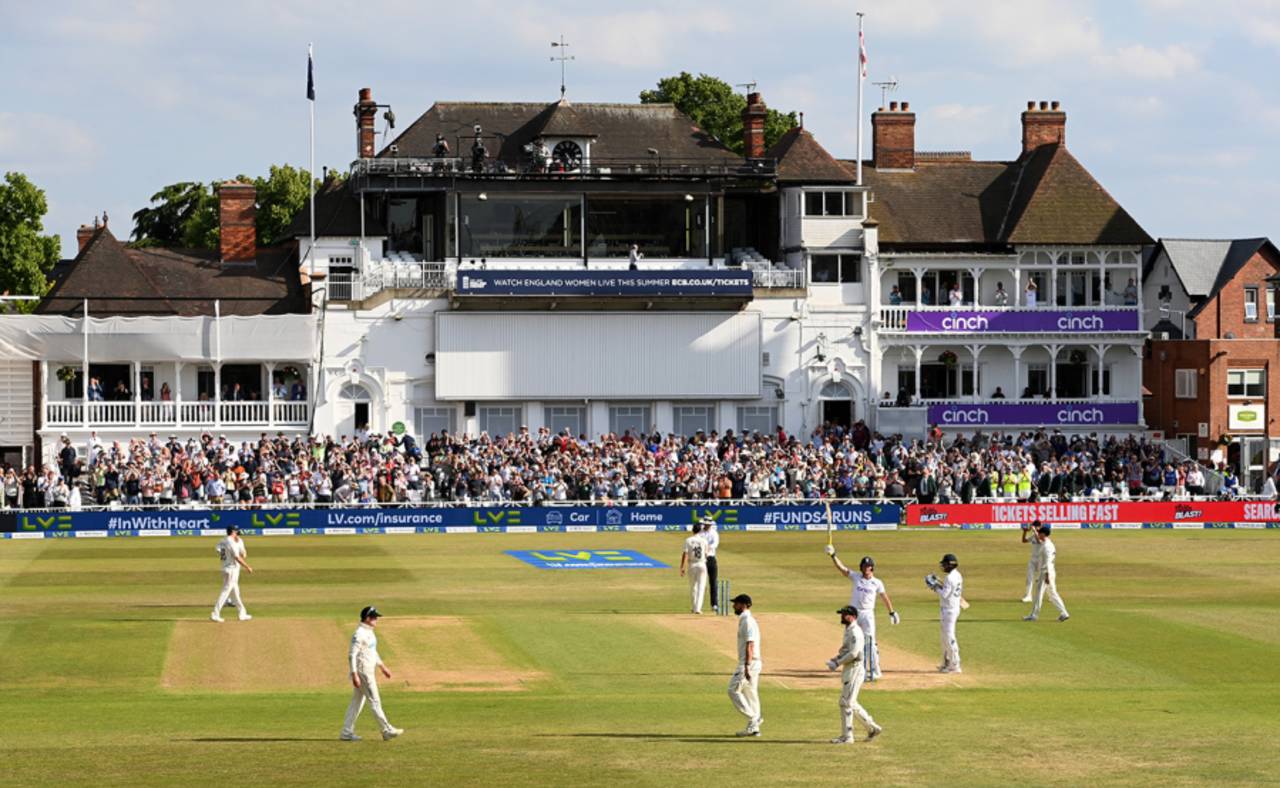
England chased down 299 at nearly six runs an over Against New Zealand at Trent Bridge in June this year • Gareth Copley/Getty Images
The idea for this article came to me towards the end of the England-New Zealand series earlier this summer. And its topicality was reinforced by what happened afterwards, in the second half of the English season, when England under Ben Stokes and Brendon McCullum took attacking cricket to new levels, playing that way not just when their team was in the ascendant but at all times. Let us look at the summer of 2022 from this angle.
At The Oval, after dismissing South Africa for 118 off 218 balls, England scored 40 more in the same number of deliveries - at a rate of 4.3 runs per over. Before South Africa knew what was happening, they were batting again, lost four wickets before reaching 100, and lost the match. England's match-winning 400-plus total at Old Trafford was scored at nearly four runs per over. Even when they lost at Lord's, they scored at almost that rate. The substantial target against India at Edgbaston was a walk in the park for the hosts at nearly five per over. Their Headingley chase against New Zealand was an even easier one, at well over five per over. Despite being 93 for 4 in the second Test against New Zealand at Trent Bridge, England motored along at an incredible run a ball. And in the first Test of the season, against New Zealand on a tough pitch at Lord's, despite losing early wickets, England's fourth-innings chase went at 3.5 per over, the best innings run rate in the match.
That means that England walked their talk irrespective of the situation. They were not just fair-weather fast scorers but kept the pedal down in most situations, and that strategy worked almost always. In this article we will look at all aspects of scoring rates for all Tests and look at the seven Tests played in England in the last four months in light of those aspects. The figures here are current up to the Lord's Test between England and South Africa.
First, a straightforward look at how the scoring rates have changed across 145 years of Test cricket - split into seven logical periods.
The scoring rate before World War I was a reasonable 2.7. This is surprising considering that the pitches were uncovered for a fair number of years. Two- and three-day Tests were common. It looks like these slow-scoring efforts in the very early years were compensated by the more rapid-scoring years after the turn of the century. And the presence of a weak South Africa helped. It is also a surprise that this rate is only matched during the years between the wars despite the presence of a number of world-class batters. The bowlers were also very good.
The post-war period was dull - reflecting the general depression in society at large. The average scoring rate dropped like a stone. It picked up and went past pre-war levels during the next two periods. Then a new Australia came to the fore and other teams picked up the cue. The scoring rate took a quantum jump to 3.2 in the two decades of the new millennium. And the whole thing was rounded off with seven extraordinary Tests in England. It is quite clear that the acceleration in scoring rates coincided with the explosion of white-ball cricket, especially T20.
During the first few years of Test cricket, the result percentage was above 80, mainly because of timeless Tests and uncovered pitches. The situation changed in the period between the wars. About 38% of matches were drawn. The batting was generally single-minded and no-result situations were acceptable. The period between 1945 and 1990 too was quite dull. Well over 40% of the matches were inconclusive.
Everything changed after 2000. Teams went for wins at the risk of losing. More important, teams could not play for draws because of the overall speed of scoring. Time was taken out of the equation.
Now, for an analysis of the teams across the years. While it is true that Zimbabwe have played over 100 Tests, they played the first of those in 1992. In the time they have been playing, the average runs per over for all teams is 3.22. It's much the same for four other teams, which is why I have drawn a line under Sri Lanka.
Australia's overall scoring rate is nearly 3. This despite the low numbers of the initial years and pedestrian post-war years, and the multiple slumps. In the next chart we will see how this number has evolved. Other than Australia, three teams have better run rates than the overall rates in the period since they played their first Test - West Indies, India and Sri Lanka.
Australia, unsurprisingly, have the best performance record. They are the only team to have an overall performance percentage (based on 2, 1 and 0 points for wins, draws and losses in that order) greater than 60. They are well over 13% better than England, who have a 53% result. South Africa have the next best record and Pakistan, the fourth best. These are the only teams to have a performance percentage greater than 50.
When we look at scoring rates, surprisingly it is Sri Lanka, with an overall scoring rate of just under 3.1, who top the charts. It is possibly because most of their cricket has been played in the last 30 years. No fewer than four teams have average scoring rates very close to 3 and could cross this magical figure in the coming years.
Let us take a look at how each team's average scoring rates evolved - by splitting the teams' playing years into convenient sub-periods. The top two teams, Australia and England, have three sub-periods each, and the other teams two each. For all teams, the last sub-period is 2000-2022.
There is no doubt that Australia are the team of the 21st century. Their average scoring rate in this period is a phenomenal 3.5-plus and they are the only team ever to have a performance percentage above the two-third mark. Note how the number of draws has drastically dropped from the previous sub-period. This is also the case with England. And England's scoring rate in this most recent period, boosted by the seven Tests this year, is a healthy 3.23, and their performance percentage well above 50.
South Africa have nearly achieved the very tough task of a 60% result in the last sub-period - way above their previous sub-period. West Indies have gone the other way with a drop of more than 20 percentage points - they are now at a one-third performance level. Their scoring rate is fine, though. New Zealand have improved by leaps and bounds, to a near 50% performance, and a scoring rate comfortably above three.
India are, arguably, the most improved team in the past 20 years. From a low performance level of 42%, they have moved to 59%, and a very healthy scoring rate of 3.3. This has happened not just when they play in India but overseas as well.
Pakistan have dropped a little. The main reason for this is the fact that prior to 2000, they were a powerful team, with great bowlers right through, but not consistently so now. Sri Lanka's progress is somewhat like India's. They are at a performance level of 50% now.
Now for the runs-per-over groups. There are ten groups for the range from 6.80 to 1.07 runs per over. It must be remembered that the population for this is 4934 team values (2476 Tests x 2 teams minus the 18 teams that never played a single ball in a Test). I have considered one value per team per Test. Let us look at the frequency distribution of the RpO values.
We have a distribution in which once the top two and last values are ignored, the other seven are distributed between 876 and 409 Tests each. There are four groups where the number of Tests is in the 600-700 range. The group with the highest RPO has only 52 teams and a very high result percentage of 83. This is understandable, and most of these instances will have occurred in this century. The slowest-scoring group has a population of 228; many of these will have occurred in the post-war periods.
The highest incidence is in the 3.3 to 3.0 range. This is quite surprising, but one of the reasons for it is that the average scoring rate in the past 35 years, during which 1500 Tests have been played, is well over 3.1.
In the lower groups, the instances of result come down quite drastically. Not surprisingly, the 2.0-2.4 group has the biggest percentage of draws - more than 40%. Nothing really happened in these matches.
A bit of trivia: the modal value is 2.91, which has 46 occurrences.
Now we move on to the more detailed numbers. Let us start with a look at the scoring rates in Test series. Remember that this is at a team level, across series of two or more Tests. In this and other tables in this article, I show the high- and low-value entries in the same table, both sets separated by a row of asterisks.
In 2005, England scored 528 for 3 and 447 for 3 in two Tests against Bangladesh, won by an innings both times, and clocked an impressive scoring rate of 5.132. They were a mere 0.002 ahead of South Africa, who, a few months earlier, scored 340 for 3 and 480 for 7 against Zimbabwe, winning both matches by an innings. The next two entries are also against Zimbabwe.
Then comes an Australian win over West Indies in 2015-16; the only difference between this and the entries above it is that West Indies managed to draw a Test. After that comes a New Zealand win over Bangladesh, followed by England's recent triple strike over New Zealand - at a scoring rate just over 4.54. Arguably, the only really significant series result because of how closely the teams were matched on strength.
At the other end of the spectrum, New Zealand, playing at home, in 1952-53, scored all of 620 runs in 433 overs. Not once in the two Tests of that series against South Africa did New Zealand get going. A couple of years later, this time away in Pakistan, New Zealand ended a series with a run rate of 1.60. That series involed an amazing innings in Dacca where New Zealand scored 69 for 6 in 90 overs but saved the Test. A few years later, New Zealand ended a five-Test series against England 1-4, with a scoring rate of 1.64.
Australia away in England in 1892, and England away in Pakistan in 1977-78, finished series with almost identical scoring rates of around 1.67. The latter was a dreary all-drawn series where none of the Tests even remotely looked like producing a result.
Above is a nuanced look at the best 50-Test sequences, where for each team I look at each Test they played and determine their average scoring rate in the next 49 Tests. Then I get the best average scoring rate for each team in those 50 matches. In this table, I have presented the best scoring rates for each team, ordered by their values.
Between 2001 and 2005, Steve Waugh's Australia had a 50-Test average scoring rate of 3.92. This is truly something. Across nearly 100 innings, in different countries, against various opponents and varied bowling attacks, Australia averaged nearly 4.0. Their performances either side of the millennium defy description. As always, they are nearly 10% ahead of the next-best team. India, between 2007 and 2011, a period that started with Rahul Dravid as captain and ended with MS Dhoni at the helm, averaged 3.60 in 50 Tests. This is indeed quite praiseworthy. Between 2013 and 2019, New Zealand averaged 3.57 in a 50-Test streak - a magnificent effort by a team that had often been at the bottom of the heap a few decades before. A slight surprise on this table is in how Sri Lanka have got ahead of England. All eight best sequences on the table came in the last 20 years. Australia have had quite a few sequences where they were above 3.5 in the pre-2000 period.
Finally, we come to the Test level. These are the highest (and lowest) scoring rates by a team in a Test match (across both innings). Matches where teams played very few overs (below 20) have been excluded.
After dismissing Zimbabwe for 54 in Cape Town in March 2005, South Africa scored 340 for 3 in the 50 overs left on the first day. This was higher than a very good ODI score, even for 2005. England dismissed Bangladesh for 104 at Chester-le-Street in June that same year and then scored at 5.73 per over. Both these were innings wins. England achieved high scoring rates in both innings recently at Headingley against New Zealand when they scored at 5.41. India scored 410 for 1 in Lahore in 2005-06 in less than 80 overs. Most of these matches ended in wins for the fast-scoring team.
At the lower end of the spectrum, we have four Tests by New Zealand. The Dacca Test has already been featured. The most amazing match in this lot is the 1957 Port Elizabeth Test between South Africa and England. Despite taking over 167 eight-ball overs to score less than 300 runs, South Africa won by 58 runs. There was some serious blocking going on there.
Onwards for a compendium of contrarian Tests, where teams lost while scoring quickly and won while scoring slowly.
India played a tough away Test in Karachi in 2005-06, where they scored at a rate of 4.46, including a 144-ball-122 by Yuvraj Singh, but lost because Pakistan's near-600-run second innings killed the contest. A few years earlier, Australia scored at exactly the same rate at Headingley in 2001 and lost because of a sporting declaration and the innings of a lifetime by Mark Butcher. A couple of years later, in Sydney, Australia overhauled England's 362 in 80 overs and galloped through the last innings at more than four an over and lost big. The one surprise here is the last entry: Bangladesh lost to India in Kolkata in a little over two days in a match that went at a frenetic pace, where Bangladesh batted for only around 70 overs but scored 300 runs.
Now for the other extreme. The South African win over England in Port Elizabeth in 1957 has featured earlier. Australia beat England in Melbourne in 1892 despite scoring at only 1.39. It can be seen that four of these Tests came in the span of a couple of years in the mid-1950s, and two just before the dawn of the 19th century. Almost all were low-scoring games.
This final table on Tests zeroes in on matches in which the two teams' scoring rates differed by a huge margin or matched each other almost identically. Again, matches in which one of the teams didn't bat or faced very few overs have been excluded.
The Cape Town encounter between South Africa and Zimbabwe in 2005 was a total mismatch and has been chronicled already. South Africa scored at 6.80 and Zimbabwe at 2.99, a whopping difference of 3.8. A few months later, when New Zealand visited Zimbabwe, the story was repeated. New Zealand scored 452 in a day's play and then Zimbabwe folded for 158 across two innings in less than a day's play - a scoring rate differential of nearly 3.1. A few years before that, when India visited West Indies, they took all of 168 overs to score 355 in Georgetown, and then West Indies rattled along at 4.8 for a few overs before rain stopped play. Australia's win in Mumbai in 2001 had a scoring-rate differential of just over 2.5, as did New Zealand's win over England in 1984.
Five pairs of teams matched their individual rates in the same match to the third decimal point. Three of these needed a difference in the fourth decimal location, making the scoring rates almost totally identical.
This is a special analysis that looks at a team's scoring rate over the span of a player's career. A player influences his team's scoring rate by his own scoring ability, or lack of. Also by the way he plays, he influences his team-mates either way. This will be known when we view the results. Normally individual batters' strike rates are rendered in terms of runs per 100 balls, but I have it as RpO so it is in sync with the rest of the article.
It is not a surprise at all that in the 96 matches in which Adam Gilchrist played, Australia achieved a scoring rate of 3.74. And Gilchrist's own scoring rate is 31% higher than the team's during this period. Most of the other batters on the table have only matched their team's scoring rate or gone a little beyond. Chris Rogers and Damien Martyn are way below their team's scoring rates, as are Simon Katich and Michael Hussey. David Warner is the other batter who has exceeded his team's scoring rate by a significant distance. After 13 Australian batters, we have Shikhar Dhawan, exceeding India's scoring rate by 17%. Andrew Strauss did not contribute much but his team struck at 3.4.
For a few New Zealand batters of the 1960s and 1970s, their team scored at between 2 and 2.2 during their careers; it's the same for Imtiaz Ahmed of Pakistan and Roy McLean of South Africa, but at least they matched their teams' scoring rates.
Readers might have noted that Virender Sehwag is missing. Since the table is ordered on the team strike rate, he is not featured because the Indian team strike rate during his playing period was 3.349 and that missed the cut-off which was 3.41. However, his own scoring rate was 4.93 and he exceeded India's rate by a huge 147.3%, the highest by any batter.
Talking Cricket Group
Any reader who wishes to join the general-purpose cricket ideas exchange group of this name that I started last year can email me a request for inclusion, providing their name, place of residence, and what they do.
Any reader who wishes to join the general-purpose cricket ideas exchange group of this name that I started last year can email me a request for inclusion, providing their name, place of residence, and what they do.
Email me your comments and I will respond. This email id is to be used only for sending in comments. Please note that readers whose emails are derogatory to the author or any player will be permanently blocked from sending in any feedback in future.
Anantha Narayanan has written for ESPNcricinfo and CastrolCricket and worked with a number of companies on their cricket performance ratings-related systems