The road to 2000 Tests
Rob Smyth
|
|||
|
Related Links
Teams:
Australia
| Bangladesh
| England
| India
| New Zealand
| Pakistan
| South Africa
| Sri Lanka
| West Indies
| Zimbabwe
|
|||
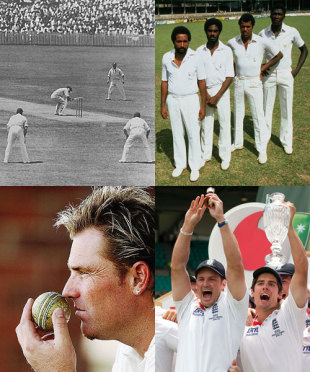
Test cricket has always been a game that needs time to breathe, so it felt appropriate that it required 134 years to reach 2000 matches. The journey took in everything from Bodyline to blackwashes, sticky dogs to drop-in tracks, wrong'uns to match-fixers. It gave us soul, blues, rock 'n' roll - and even, thanks to Dennis Lillee's aluminium bat, a bit of metal (if not quite of the heavy variety).
The 2000 Tests have produced a million stories and an infinite number of statistics - it can only be a matter of time before the verb "to statsguru" is added to the Oxford English Dictionary. The collection of figures produced in these games - from batting averages to match-winning sixes to the strike rate of left-handed batsmen when their side has been asked to bat first in Australasia - is dizzying. But it contains clues as to how the format reached the landmark with India's trip to Lord's in July.
The Test match may feel like a sacred constant in a flighty world, yet that is more of a philosophical instinct than an accurate reflection of what we see on the field: the game has changed enormously since the start of the 1990s, never mind the 1890s. That said, there have been a few relative constants, perhaps the most significant being the supremacy of the Australians. They have won the most Tests (despite playing almost 200 fewer than England); they have comfortably the highest win percentage and best win/loss ratio; per wicket, the highest number of runs scored and the lowest number conceded (if we exclude the anomaly of the ICC World XI). They are even top of the pile when it comes to the peculiar glory of the tie: Australia were involved in both, against West Indies in Brisbane in 1960-61, and in Madras in 1986-87.
| Team | % Won | Win/loss ratio | Runs/wkts for | Runs/wkts against |
| Australia | 46.71 | 1.77 | 34.09 | 29.40 |
| England | 35.41 | 1.23 | 32.22 | 30.38 |
| South Africa | 34.91 | 1.00 | 31.80 | 30.80 |
| West Indies | 32.34 | 0.98 | 32.49 | 32.19 |
| Sri Lanka | 30.34 | 0.85 | 33.32 | 33.48 |
| Pakistan | 30.16 | 1.08 | 32.41 | 32.36 |
| India | 24.33 | 0.78 | 33.54 | 35.19 |
| New Zealand | 18.68 | 0.46 | 28.28 | 35.04 |
| Zimbabwe | 9.63 | 0.16 | 26.57 | 39.23 |
| Bangladesh | 4.41 | 0.05 | 21.68 | 50.17 |
| ICC World XI | 0.00 | 0.00 | 16.70 | 27.20 |
Australia's hegemony over the first 2000 Tests is incontrovertible. Their win percentage of almost 47 is more than 11 higher than the next best, by England and South Africa - and it rose to a startling 65% in the fourth block of 500 Tests. Modern converts to Test cricket may be surprised to learn that India's win percentage of 24 puts them seventh on the all-time list, above only New Zealand, Zimbabwe and Bangladesh, although the rise in that figure over each chunk of 500 Tests - 8, 19, 23, 41 - attests to their ascent. As Test cricket gained one superpower, so it lost another: West Indies' win percentage dropped from 44 (Tests 1001-1500) to a miserable 13 (Tests 1501-2000).
Although there is a legitimate sense that Test cricket still prioritises quality over quantity, the volume of matches has inevitably increased. It took almost as long to get from 100 to 200 Tests (23 years) as it did to get from 1000 to 2000 (27). The four blocks of 500 took 83, 24, 16 and 11 years.
The primary reason is the growing number of teams. England and Australia played the first Test in March 1877. South Africa joined the fold 12 years later, and West Indies' entry in 1928 was the first of three in four years, along with New Zealand and India. Pakistan joined in 1952, five years after Partition. It was nearly 30 years before the next newcomers, Sri Lanka. Zimbabwe became the ninth Test-playing nation in 1992 (a few months after South Africa played their first Test following 22 years of isolation). Bangladesh was the most recent addition, in 2000.
| 1-500 | 501-1000 | 1001-1500 | 1501-2000 | 1-2000 | |
| 1877-1961 | 1960-1984 | 1984-2000 | 2000-2011 | 1877-2011 | |
| Wins | 340 | 279 | 309 | 372 | 1300 |
| Runs | 452,176 | 496,298 | 478,420 | 534,055 | 1,960,949 |
| Wickets | 15,471 | 15,322 | 14,993 | 15,423 | 61,209 |
| Balls bowled | 1,066,203 | 1,113,981 | 1,006,286 | 991,113 | 4,177,583 |
| Runs per wicket | 29.22 | 32.39 | 31.90 | 34.62 | 32.03 |
| Runs per 100 balls | 42.40 | 44.55 | 47.54 | 53.88 | 46.93 |
| Balls per wicket | 68.91 | 72.70 | 67.11 | 64.26 | 68.25 |
| Days to play 500 Tests | 30,610 | 8,736 | 5,681 | 4,052 | 49,079 |
Note: The 500th and 501st Tests both began on December 30, 1960; Australia v West Indies at Melbourne started a few hours before India v Pakistan at Calcutta. They finished on January 3 and January 4, 1961, respectively.
But some fixtures remained off-limits for a time. Australia played only once against New Zealand before 1973 - and that game, in 1946, was given Test status only retrospectively - because they did not deem them worthy opponents. (The fact that New Zealand were defenestrated for 42 and 54 in that Test hardly helped.) England did not play more than one-off Tests against Sri Lanka until 2001, almost two decades after Sri Lanka's inaugural Test; India and Pakistan did not play each other between 1989 and 1999.
Not everyone regarded this as a bad thing. From 1982 to 1989, India and Pakistan met 20 times, drawing 16. Indeed, draws abounded throughout the 1980s, when 46% of Tests finished that way, just behind the 1960s (47%). There has been occasional concern about what Steve Harmison dubbed "chief executive's pitches", yet the reality is that things have improved enormously: in the first decade of the 21st century, only 25% of Tests were drawn. Indeed the most startling change in Test cricket has been the increasingly attacking nature of the game. This is reflected not only by the rise in positive results, but also by the change in scoring-rates, which leapt from 2.86 per over in both the 1980s and 1990s to 3.20 in the 2000s. Heavier bats, and minds liberated by limited-overs cricket, have changed the nature of Test cricket indelibly.
| 1-500 | 501-1000 | 1001-1500 | 1501-2001 | Overall | |
| Australia | 49.20 | 34.02 | 43.75 | 65.32 | 46.71 |
| England | 40.48 | 30.67 | 22.08 | 45.45 | 35.41 |
| South Africa | 19.01 | 36.66 | 45.71 | 47.41 | 34.91 |
| West Indies | 29.06 | 38.51 | 44.44 | 13.27 | 32.34 |
| Sri Lanka | - | 0.00 | 20.45 | 42.57 | 30.34 |
| Pakistan | 25.80 | 21.55 | 35.53 | 35.55 | 30.16 |
| India | 8.69 | 19.07 | 23.21 | 41.17 | 24.33 |
| New Zealand | 1.92 | 16.36 | 21.36 | 28.23 | 18.68 |
| Zimbabwe | - | - | 6.97 | 12.50 | 9.63 |
| Bangladesh | - | - | - | 4.41 | 4.41 |
| ICC World XI | - | - | - | 0.00 | 0.00 |
If the 2000s were all about four-balls, then the 1980s had been about foursomes - the soul-crushing, bone-busting West Indies pace quartet, and the quartet of allrounders who battled for unofficial supremacy: Ian Botham, Richard Hadlee, Imran Khan and Kapil Dev.
Other periods have a similarly distinctive identity. There was the Golden Age at the turn of the 20th century, while the 1990s will be remembered for its magnificent array of new-ball pairs. Fast bowlers around the world averaged 29.73 runs per wicket in that period, the second-lowest in any decade since the war. (The 1950s lead the way, with an average of 26.89.) It is also no surprise that, with flat pitches and crammed schedules endangering the fast bowler, this average rose to 33.22 in the 2000s - the second-highest of all, behind the 1920s (33.64).
The 1990s were also notable for the revival of spin bowling, led by Shane Warne, Muttiah Muralitharan and Anil Kumble. The average runs-per-wicket figure has not changed too much - from 37.61 in the 1980s to 35.56 in the 1990s and 35.72 in the 2000s - but there has been a significant improvement in strike-rate. This is in contrast to fast bowling, where it has stayed between 62 and 63 for the last three decades. Spinners took their wickets every 91 balls in the 1980s, every 82 in the 1990s and every 73 in the 2000s.
There are many reasons for this, chief among them the change in attitude of both spinners and umpires. Warne was the poster boy for a new generation of slow bowlers who preferred aggression to attrition; around the same time, umpires became more inclined to give batsmen out lbw on the front foot, a significant shift that started when Darrell Hair in particular decided to wage war on pad-play. The advent of Hawk-Eye supported Hair's decisions, and made umpires realise that more deliveries were hitting the stumps than they had previously thought. By the 2000th Test, two of the three bowlers with the highest percentage of lbws (from at least 50 Test wickets) were contemporary spinners: Ajantha Mendis and Graeme Swann. (The other was Terry Alderman.) For all types of bowlers, lbws accounted for almost 11% of wickets in the first 500 Tests; in the most recent block of 500, that had risen to 17%.
There were other striking changes in the nature of wicket-taking. In the first 500 Tests, 31% of wickets were bowled; in Tests 1501-2000 that was almost halved, to 16%. Indeed, in the first 500, a batsman was more likely to have his stumps disturbed, by any means: there were 530 stumpings, more than double the highest for any of the three other blocks, and 72 hit-wicket dismissals. In the next 1500, there were only 79 hit-wickets.
With a batsman's castle becoming his kingdom, and fast bowlers concentrating less on the mantra of "you miss, I'll hit" and more on the corridor of uncertainty, another wicket-taking method became even more common. The catch has always been the modish mode of dismissal, but its frequency has increased in the last 50 years. In the first 500 Tests, just over half of all batsmen dismissed were out caught. In each of the subsequent blocks of 500, that figure was 60 or 61%. The only dismissal that has stayed relatively constant is the run-out: the words "yes", "no" and "sorry" have had fairly equal prominence in all eras.
As some things stay the same, others change to a staggering degree - such as the number of left-hand batsmen, and especially the number of runs they have scored. Southpaws were responsible for only 15% of runs off the bat in the first 500 Tests; that rose to 22% in the second 500, then 26% and finally 36%. Given that 15% - at the high end of the estimate - of people are believed to be left-handed, this is an enormous dichotomy, and may be explained by the fact that many left-hand batsmen are otherwise right-handed (with their dominant right hand at the top of the bat handle). Studies show the numbers of left-hand participants are similar in other interactive sports, such as tennis, boxing, baseball and fencing. The figures are not the same for sports in which there is no formal direct combat, which suggests the left-hander's advantage is partially a consequence of the effect the unusual stance has on opponents. No single theory has been established, though it has frequently been suggested that left-handers enjoy significant neurological and tactical advantages. Anyone who has watched a new-ball bowler struggle with his line to a left-hand/right-hand combination will attest to the latter.
| All dismissals | Bowled | Caught | Lbw | Stumped | Run out | Hit wkt | Other | |
| 1-500 | 15,471 | 4766 | 7821 | 1683 | 530 | 597 | 72 | 2 |
| 501-1000 | 15,322 | 3351 | 9232 | 1895 | 242 | 557 | 42 | 3 |
| 1001-1500 | 14,993 | 2571 | 9207 | 2470 | 219 | 506 | 19 | 1 |
| 1501-2000 | 15,423 | 2542 | 9444 | 2649 | 260 | 506 | 18 | 4 |
| 1-2000 | 61,209 | 13,230 | 35,704 | 8697 | 1251 | 2166 | 151 | 10 |
| Bowled | Caught | Lbw | Stumped | Run out | Hit wk | Other | |
| 1-500 | 30.81 | 50.55 | 10.88 | 3.43 | 3.86 | 0.46 | 0.01 |
| 501-1000 | 21.87 | 60.25 | 12.37 | 1.58 | 3.64 | 0.27 | 0.02 |
| 1001-1500 | 17.15 | 61.41 | 16.47 | 1.46 | 3.37 | 0.13 | 0.01 |
| 1501-2000 | 16.48 | 61.23 | 17.18 | 1.69 | 3.28 | 0.11 | 0.03 |
| 1-2000 | 21.61 | 58.33 | 14.21 | 2.04 | 3.54 | 0.25 | 0.02 |
But the numbers do not always support the hunches. There is a widespread perception, for example, that the quality and efficacy of lower-order batting has increased considerably in the last 30 years. Yet while the batting average of Nos. 8 to 11 was 14.75 in the first set of 500 matches, it has barely changed since: 15.35, 14.85 and 15.77.
One area that has palpably improved, however, is that of the wicketkeeper-batsman, so much so that "batsman" has a decent argument for being the first noun in the compound. In the first 1500 Tests, keepers averaged 24.05 with the bat; in the next 500, the Age of Gilchrist, it was 32.14.
The game continues to evolve in myriad ways. A prime example is what a captain does at the toss. It was once said that if you win the toss, you bat first nine times out of ten - and on the tenth occasion you think about bowling and then bat anyway. The quote has been attributed to everyone from WG Grace to Ian Chappell to Uncle Tom Cobley. But although the stigma remains so much greater when you bowl first and concede 400 than when you bat first and are out for 100 - just ask Nasser Hussain and Ricky Ponting - a growing number of captains are happy to take the risk. In the first block of 500 Tests, captains chose to bowl first in only 46 matches; by the second lot of 500 - between 1960 and 1984 - that had risen to 131, and then to 183 and 167.
Bowling first can be an aggressive move, and so much of Test cricket's new-found positivity is a consequence of the enlightenment that has come through playing one-day cricket, be it urgent running between the wickets or agile fielding. For the most part, Tests and one-day internationals have coexisted comfortably, but the introduction of Twenty20 has reinforced the old adage that three can be a crowd. The number of Tests per year has fallen slightly in recent times (although this may in part be down to Zimbabwe's temporary exile and security worries in Pakistan), and there has been a worrying inclination to compromise Test cricket for other forms of the game.
In 1980 - the last year in which there were more Tests played than one-day internationals - the five-day game accounted for 54% of international fixtures. In 1990, that figure was 30%, then 26% in 2000, and 17% in 2010.
As with all rare birds, those who cherish Test cricket fear its extinction. That is not imminent but, despite some wonderful contests in the past year alone, the format is arguably facing its biggest crisis in decades. If we project the rate of Test matches in the five calendar years from 2007 to 2011, we should reach 2500 Tests just before the end of 2023, while the 3000th will be played early in 2036 - or even sooner, if new teams are invited into the fold. Perhaps it will be an Ashes decider in Sydney, or Afghanistan v Ireland in a four-day match on the moon. Nobody knows where Test cricket is heading, but the first 2000 Tests taught us that - statistically and actually - the possibilities are endless.