No longer a fortress
India have never won a Test in Barbados, but will start confidently knowing that West Indian supremacy at the venue is a thing of the past
Madhusudhan Ramakrishnan
27-Jun-2011
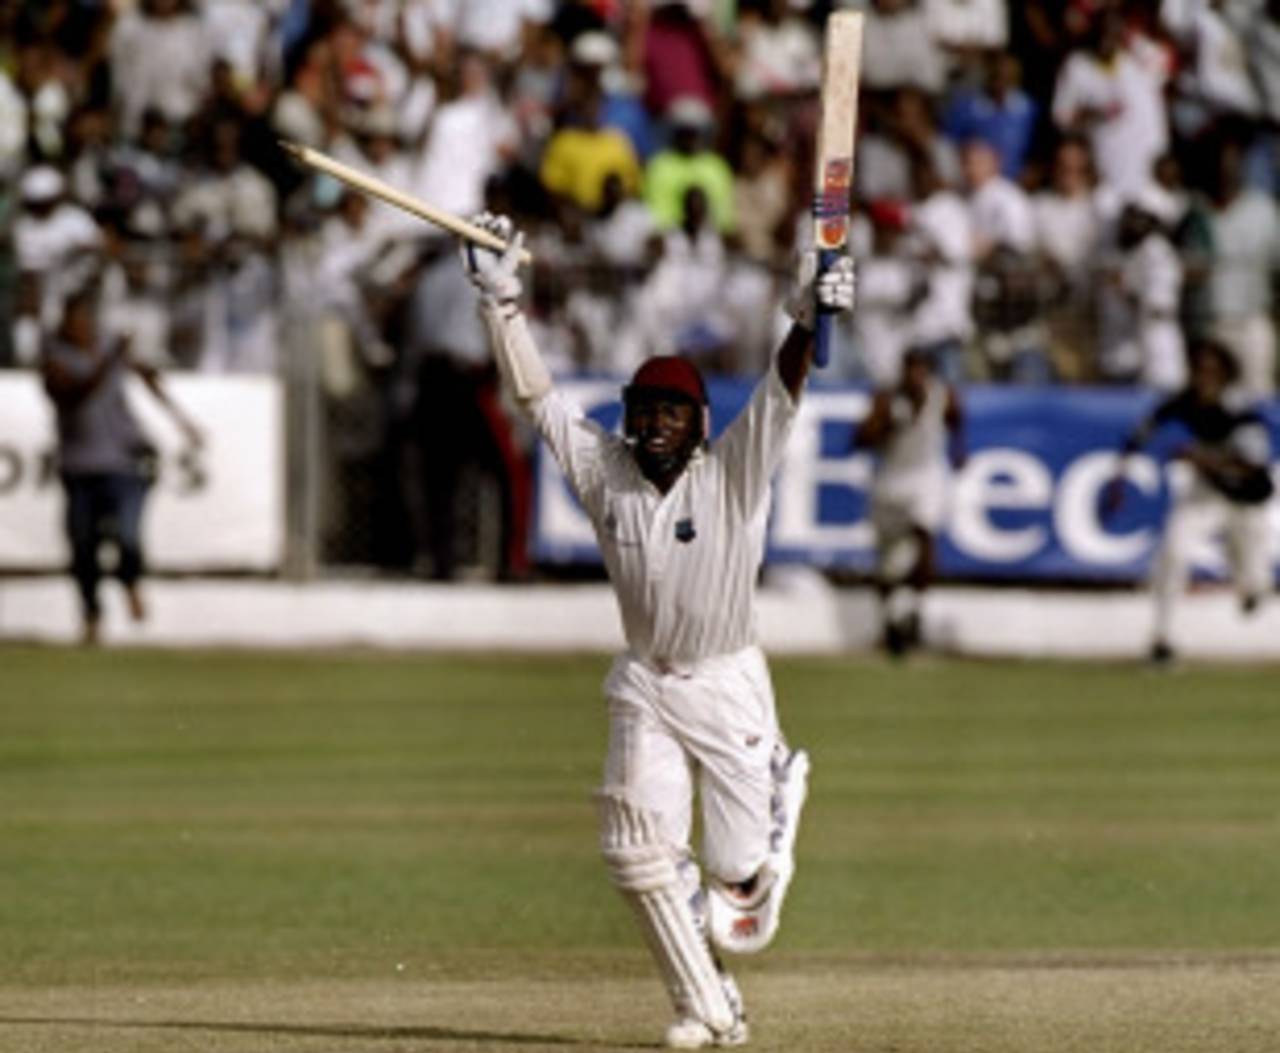
West Indies have won just two Tests in Barbados since the remarkable one-wicket win in 1999 • Getty Images
A proud record tarnished
Going by West Indies' abysmal Test record in recent years, the fact that the Kensington Oval in Barbados was once an impregnable fortress for the home side would come as a shock to many. After a four-wicket loss in the second match at the venue in 1935, West Indies did not lose a single Test in Barbados for the next 59 years till the 208-run defeat against England in 1994. Between 1978 and 1993, in a period of extraordinary dominance, West Indies won 12 consecutive Tests at the venue. Following the defeat against England in 1994, West Indies lost the first Test of the series against Australia in 1995. This defeat was a precursor to their first home-series defeat in 22 years. Although they were no longer a force in Barbados, West Indies managed to squeeze out close wins against India and Australia in 1997 and 1999. While India, who were chasing only 120 in the third Test of the 1996-97 series, collapsed to be bowled out for 81, it was Brian Lara's unbeaten 153 that helped West Indies achieve a one-wicket win against Australia in 1999.
Going by West Indies' abysmal Test record in recent years, the fact that the Kensington Oval in Barbados was once an impregnable fortress for the home side would come as a shock to many. After a four-wicket loss in the second match at the venue in 1935, West Indies did not lose a single Test in Barbados for the next 59 years till the 208-run defeat against England in 1994. Between 1978 and 1993, in a period of extraordinary dominance, West Indies won 12 consecutive Tests at the venue. Following the defeat against England in 1994, West Indies lost the first Test of the series against Australia in 1995. This defeat was a precursor to their first home-series defeat in 22 years. Although they were no longer a force in Barbados, West Indies managed to squeeze out close wins against India and Australia in 1997 and 1999. While India, who were chasing only 120 in the third Test of the 1996-97 series, collapsed to be bowled out for 81, it was Brian Lara's unbeaten 153 that helped West Indies achieve a one-wicket win against Australia in 1999.
However, since the start of the 2000s, the record at the venue has been far from encouraging. West Indies have won only two Tests and lost six since 2000. While Australia, England and South Africa have asserted their superiority over West Indies in Barbados in recent times, India are yet to win a Test at the venue. In 2002, India went 1-0 up in the series after the win in Trinidad, only to lose the series 2-1 after defeats in Barbados and Jamaica. After a comfortable win in the first Test, a buoyant India will look at this as a perfect opportunity to erase a dismal record at a venue where they have lost seven out of eight Tests. West Indies, on the other hand, will look to draw inspiration from their record at the venue in the 1980s and 1990s, when they went on to win 14 out of 17 Tests.
| Period | Matches | Won | Lost | Draw | W/L ratio |
| 1930-1969 | 11 | 3 | 1 | 7 | 3.00 |
| 1970s | 7 | 2 | 0 | 5 | - |
| 1980s | 7 | 7 | 0 | 0 | - |
| 1990s | 10 | 7 | 2 | 1 | 3.50 |
| 2000-2011 | 11 | 2 | 6 | 3 | 0.33 |
All-round decline for West Indies
West Indies dominated visiting teams in Barbados Tests in both the batting and bowling departments for much of the 1970s and 1980s. While their batting average was very good in the 1970s, the bowling performance was still not very impessive. However, in the 1980s, the difference between the batting and bowling averages was nearly 18. In the same period, the figure was -26 for Australia and -21 for England. Only Pakistan, who had an excellent fast-bowling attack, came close to matching the performance of West Indies in the 1980s. In the next decade, the difference between West Indies and other teams was much more narrow. England and Australia, who won a Test each in Barbados during the 1990s, did much better than in previous years. India bowled superbly in their only game in 1997, but struggled with the bat against a quality West Indian attack. In Tests since 2000, Australia and England have been the outstanding batting sides among visiting teams while South Africa, who have a bowling average of just over 23, have been the best bowling side by far. The average difference of -7.88 for the West Indies is their lowest since the start of 1970.
West Indies dominated visiting teams in Barbados Tests in both the batting and bowling departments for much of the 1970s and 1980s. While their batting average was very good in the 1970s, the bowling performance was still not very impessive. However, in the 1980s, the difference between the batting and bowling averages was nearly 18. In the same period, the figure was -26 for Australia and -21 for England. Only Pakistan, who had an excellent fast-bowling attack, came close to matching the performance of West Indies in the 1980s. In the next decade, the difference between West Indies and other teams was much more narrow. England and Australia, who won a Test each in Barbados during the 1990s, did much better than in previous years. India bowled superbly in their only game in 1997, but struggled with the bat against a quality West Indian attack. In Tests since 2000, Australia and England have been the outstanding batting sides among visiting teams while South Africa, who have a bowling average of just over 23, have been the best bowling side by far. The average difference of -7.88 for the West Indies is their lowest since the start of 1970.
| Period | West Indies | Australia | England | India | Pakistan | South Africa |
| 1970s | 46.94/33.90 | 32.87/40.76 | 39.52/74.50 | 28.20/58.45 | 36.30/37.33 | - |
| 1980s | 41.05/23.24 | 26.30/53.00 | 18.35/39.33 | 26.45/48.18 | 30.05/31.88 | - |
| 1990s | 31.57/28.73 | 27.26/29.46 | 38.68/32.56 | 20.00/21.90 | 24.15/48.40 | 24.65/27.25 |
| 2000-2011 | 29.64/37.48 | 52.12/30.37 | 59.90/36.79 | 19.90/39.90 | 28.51/36.64 | 38.87/23.31 |
Visiting teams dominate pace-bowling stats
Over the years, Barbados has proved to be a pace-friendly wicket. In Tests since 1970, fast bowlers have picked up 863 wickets at an average of 29.38 and strike rate of 57.9. Spinners have struggled to make inroads though; they average 43.16 at a strike rate of 94.1 in the same period. West Indian pace bowlers were at their dominant best in the 1980s contributing to 131 dismissals in seven Tests (average of 19 per match). Their bowling average (21.03) and strike rate (42.7) are well above those of the visiting teams in that decade. Although their performance fell away in the 1990s, only Australia had better numbers (min two matches played in Barbados in the decade). The stats since 2000 provide the perfect illustration of how poor West Indian pace attacks have become in recent years. Their average (35.55) and strike rate (68.2) are extremely poor, and have been surpassed by South Africa, Pakistan and England. A major deterrent to their success in the period has been the fact that the home fast bowlers have only managed to pick up under 11 wickets per game (119 in 11 Tests).
Over the years, Barbados has proved to be a pace-friendly wicket. In Tests since 1970, fast bowlers have picked up 863 wickets at an average of 29.38 and strike rate of 57.9. Spinners have struggled to make inroads though; they average 43.16 at a strike rate of 94.1 in the same period. West Indian pace bowlers were at their dominant best in the 1980s contributing to 131 dismissals in seven Tests (average of 19 per match). Their bowling average (21.03) and strike rate (42.7) are well above those of the visiting teams in that decade. Although their performance fell away in the 1990s, only Australia had better numbers (min two matches played in Barbados in the decade). The stats since 2000 provide the perfect illustration of how poor West Indian pace attacks have become in recent years. Their average (35.55) and strike rate (68.2) are extremely poor, and have been surpassed by South Africa, Pakistan and England. A major deterrent to their success in the period has been the fact that the home fast bowlers have only managed to pick up under 11 wickets per game (119 in 11 Tests).
| Period | West Indies | Australia | England | India | Pakistan | New Zealand | South Africa |
| 1970s | 27.71, 60.1 | 35.31, 74.4 | - | - | 30.58, 58.5 | 28.66, 59.4 | - |
| 1980s | 21.03, 42.7 | 44.44, 74.8 | 30.04, 52.5 | 45.33, 79.4 | 29.76, 51.2 | - | - |
| 1990s | 27.76, 58.3 | 25.78, 53.8 | 31.31, 55.2 | 21.33, 42.5 | 48.66, 68.8 | 49.30, 101.1 | 26.84, 48.3 |
| 2000-2011 | 35.55, 68.2 | 31.30, 68.4 | 33.86, 63.0 | 48.16, 100.0 | 34.88, 63.0 | 21.23, 43.3 | 21.30, 45.5 |
Consistency issues for top-order batsmen
While the lack of bowling quality has been the biggest reason for West Indies' struggles, inconsistent batting performances have also contributed significantly to their woes. For nearly 15 years from 1975-76, the prolific top-order of Gordon Greenidge, Desmond Haynes and Viv Richards was responsible for setting up highly competitive scores which more often than not proved unassailable for most teams given the strength of the West Indian bowling. However, since their retirements in the early 1990s, the top-order performances have drastically declined. The contrast is most evident in the stats for the second wicket in Barbados Tests; in the 1980s, there were five century stands for the second wicket at an average over 90. In the 1990s, however, the second-wicket partnership averaged just 28 without a single century stand. In matches since 2000, the middle order (wickets 4-6) has done much better than the top order (wickets 1-3). While the top-order has featured in four century partnerships and nine half-century partnerships at an average of 29.28, the middle order averages 47.37 with nine century stands and nine half-century stands.
While the lack of bowling quality has been the biggest reason for West Indies' struggles, inconsistent batting performances have also contributed significantly to their woes. For nearly 15 years from 1975-76, the prolific top-order of Gordon Greenidge, Desmond Haynes and Viv Richards was responsible for setting up highly competitive scores which more often than not proved unassailable for most teams given the strength of the West Indian bowling. However, since their retirements in the early 1990s, the top-order performances have drastically declined. The contrast is most evident in the stats for the second wicket in Barbados Tests; in the 1980s, there were five century stands for the second wicket at an average over 90. In the 1990s, however, the second-wicket partnership averaged just 28 without a single century stand. In matches since 2000, the middle order (wickets 4-6) has done much better than the top order (wickets 1-3). While the top-order has featured in four century partnerships and nine half-century partnerships at an average of 29.28, the middle order averages 47.37 with nine century stands and nine half-century stands.
| Period | 1st wicket | 2nd wicket | 3rd wicket | 4th wicket | 5th wicket | 6th wicket |
| 1970s | 48.36, 2/2 | 79.70, 3/2 | 44.30, 1/1 | 43.80, 1/2 | 30.90, 0/1 | 84.77, 4/0 |
| 1980s | 46.90, 1/2 | 90.30, 5/3 | 32.11, 0/3 | 35.77, 0/3 | 53.88, 2/1 | 51.22, 2/2 |
| 1990s | 48.00, 2/5 | 28.00, 0/5 | 39.82, 2/1 | 54.35, 4/4 | 29.47, 1/1 | 34.00, 2/2 |
| 2000-2011 | 30.10, 1/3 | 27.15, 2/2 | 30.60, 1/4 | 56.95, 4/4 | 45.84, 3/3 | 38.84, 2/2 |