The 20 most extreme pitches in Test cricket
Where does the Ahmedabad turner rank among the most bowler-friendly pitches in Test history? And which pitch was the most batsman-friendly?
Anantha Narayanan
13-Mar-2021
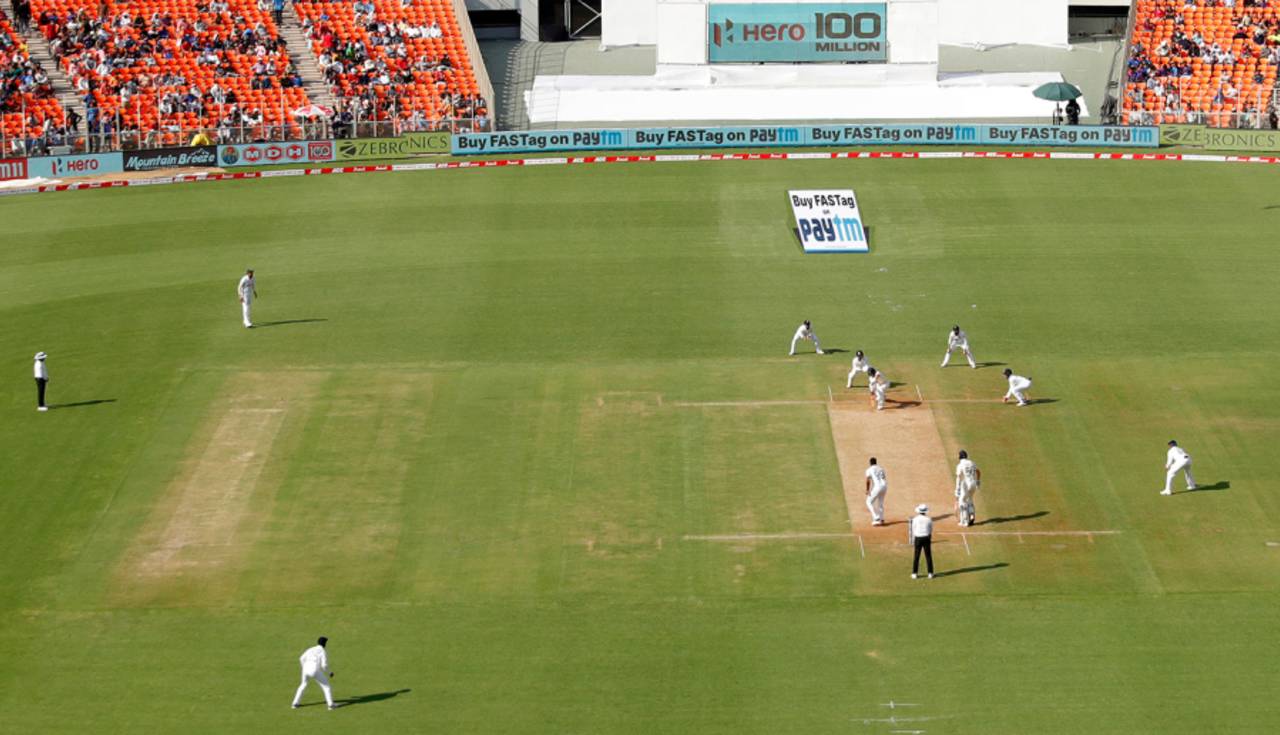
Was it lack of technique or an unplayable pitch that led to England's collapses in the day-night Test in Ahmedabad? • Saikat Das/BCCI
I know what you are thinking - that I am going to write about the pitch used for the recent day-night Test in Ahmedabad. Yes and no. Yes, I will be looking into it, but I will cover the entire range of pitches, not just the Ahmedabad type, where 20 wickets fell in three sessions but also pitches on which ten wickets were taken across five days. In my opinion, it is not right to have pitches that make batting a complete lottery or ones that force bowlers to consider quitting the game.
I will select ten extreme pitches at either end of the spectrum using the PQI (Pitch Quality Index), one of my derived measures. The PQI is an excellent measure to determine the true nature of the pitch. Because the expected performances of the players are built in, PQI allows for normalisation across players at the extreme ends of the spectrum.
The PQI is dependent on six values: The expected runs from the batsmen (based on Career-Location Weighted Batting Average values), actual runs of the batsmen, expected wickets from the bowlers (based on Career-Location Balls-per-Wicket figures), actual wickets of the bowlers, average Runs-per-Wicket, and actual Runs-per-Wicket values. Actual career figures are used rather than career-to-date figures since this is a secondary value and I want some stability in the calculations. All these figures are used to derive the PQI. A low PQI indicates a bowler-friendly pitch and a high PQI indicates a batting pitch.
To start with, the following ratios are determined:
- actual runs to expected runs
- actual wickets to expected wickets
- actual RpW to base RpW (determined for that particular period)
- actual wickets to expected wickets
- actual RpW to base RpW (determined for that particular period)
Since each of these PQI-R values has a range of 0.0 to 3.0, the sum of the PQI-R values, which is the first-level PQI, has a range of 0.0 to 9.0. However, since the median of this distribution is 3.047, I have mapped these to a 100-based PQI. The raw PQI of 3.0 maps on to 50.0. There is graded extrapolation on either side, on ranges of 0.0 to 3.0 and 3.0 to 9.0 respectively. The mean PQI value across the 2414 Tests played in the history of the game is 49.9, indicating the solidity of the analyses. The median of PQI values is 50.5.
Let us first look at Tests in which bowlers ruled. This is a table ordered on PQI. To say that the batsmen struggled in these matches is a huge understatement. At this point, let us not start looking at whether the batsmen lacked technique or not. This analysis uses the numbers on the scorecard, which is the only source of data one can work with.
When South Africa toured Australia in 1931-32, they encountered a typical vicious MCG "sticky" and were dismissed for 36 in less than an hour and a half. Bill O'Reilly did not even have to bowl. Don Bradman twisted his ankle while going out to field, but he certainly was not needed. Australia took just over two and a half hours to score 153 at a run a minute and South Africa were then dismissed for 45. The numbers speak for themselves. The PQI is an astonishing 14.5.
England's tour of the West Indies in 1934-35 saw, arguably, the craziest Test match ever. On a difficult pitch in Barbados, West Indies managed 102 in their first innings, which was followed by two declarations for very low scores, and a win for England by four wickets. The batting order looked like it was decided by a draw of lots. Wally Hammond's 43 and 29 not out looked gold-wrapped. The PQI was 18.0.
The third Test on this list was played at Lord's in 1888. Twenty-seven wickets fell on the second day - the most over a single day. Australia's first-innings score of 116 was enough to give them a winning margin of 61 runs (the other three innings scores were 53, 60 and 62). The RpW figure is 7.3 and the BpW figure is 19.8 - both the lowest ever in Tests.
The next Test featured - at The Oval in 1896 - is similar to the one above it in many ways, except for two innings going past 100. The PQI value, accordingly, is just over 20.
In 2002, India were caught on a seaming pitch in Hamilton, but despite being dismissed for 99, they still managed to secure a five-run first-innings lead and eventually set New Zealand a target of 160. New Zealand were struggling at 105 for 5 before Jacob Oram saw them home. A mere 14 runs per wicket and a wicket every five overs gave it a PQI of just over 20.
In the next entry, a match RpW of 12.9 and a wicket every five overs, the fact that the two teams had good batsmen, and that two novices, Axar Patel and Joe Root, took 16 wickets between them, all contributed to the day-night Ahmedabad Test's low PQI of 21.5 - the sixth-worst pitch ever. It does not matter what those in favour of the pitch have said. The numbers tell you that this pitch was a diabolical one, making it 80-20 in favour of the bowlers. It must be acknowledged here that the skiddy nature of the pink ball played an important part in the extreme discomfiture of the batsmen.
In the same series, it was possible for batsmen to put their heads down and play a reasonable innings in the second Test, in Chennai, and in the fourth Test, in Ahmedabad. But it was not possible to do that in the day-night Test. Those who talk of batsmen lacking in technique, can they tell us how England could have handled the first few overs of their second innings? Play forward and pop up a catch to any of the close fielders, if the ball turned. Play back and get hit on the bat or pad, if the ball zipped in off a length. Go out to attack, score a few runs and convert every ball into a book-cricket lottery. That is not Test cricket. Yes, India won. But in an alternative universe, they could have lost. Would the comments have been similar from both sides of the pitch divide then?
The next Test on the list is the famous 1882 Ashes Test at The Oval. Australia won by seven runs. The RpW was below ten and it required less than five overs for a wicket to fall, on average. The PQI remained around the 22-mark.
In Wellington in 1945-46, New Zealand's 42 and 54 bookended an Australian total just below 200. The RpW was a very low 10.5. Australia, with seven debutants, beat New Zealand, who had six of their own, by an innings.
The ninth Test on this list also had one a couple of crazy declarations, this time on a Brisbane "sticky" in 1950-51. Australia made 228 in the first innings and then England declared on 68 for 7 and Australia on 32 for 7. England were set a target of 193, collapsed to 46 for 8, and were eventually dismissed for 122. Len Hutton's 62 not out from No. 8, is one of the greatest bad-pitch innings ever played.
The last Test featured here will still be fresh in the minds of many current watchers of Test cricket. This was the Wankhede match of 2004. In India's second innings total of 205, VVS Laxman and Sachin Tendulkar made half-centuries, and while they were at the crease, the pitch looked totally different from when others batted. Their sure-footed movement, silken touch and propensity to punish the loose balls made the partnership a visual delight. And their stand won the match for India - the Indian spinners were incidental. Michael Clarke's 6 for 9 at the Wankhede and Joe Root's 5 for 8, 18 years later in Ahmedabad, confirm that the pitches were minefields as far as batsmen were concerned.
The PQI values for these ten Tests run from 14.5 to 22.9. The RpW values range from 7.3 to 15.1, and the BpW values are all below 31.1. What has differentiated these Tests is the quality of players who played in these matches - that has separated the PQI values. Five of these Tests were played before World War II and three in the new millennium (all three featuring India). Maybe there is food for thought there.
The PQI is a very complex derivation; however, interested readers will be pleased to know that the RpW and BpW serve as reasonable and simpler replacements if anyone wants to do their own analysis. Later in this article I have a couple of tables ordered on these two secondary metrics. You will see the correlations between the three values at that point.
The average aggregate runs for these ten Tests is 383 and on average, 35 wickets fell in each. The average RpW is 11 and the average BpW is 27. Finally, the average PQI value is 20.5.
Now, we will move to the other extreme. There is a tendency to ignore these batsmen-friendly matches when it comes to criticising pitches, for various reasons:
- Batting records are set, which brings a high degree of acceptability to the matches
- The attitude of the viewing public is generally batsman-friendly
- Broadcasters are satisified because such Tests go the distance - over 30 hours means a lot of advertising spots. In contrast, all the low-PQI Tests are decisive, but on average, have lasted less than half the time allotted to a match.
How do I chronicle ten Test matches in which the average RpW value was nearly 100 and it took more than 31 overs to take a wicket; In which four triple-hundreds, nine doubles and 30 hundreds were scored? That means an average of over four hundreds per match. It is also difficulty to evaluate these Tests in a proper manner because they contain a few world records. I am sure there will be righteous indignation over the first lot of Tests, irrespective of the fact that all ended in results. I think these ten Tests, despite all being drawn, will not bring that level of condemnation.
The first of these Tests, in Delhi in 1955-56, captures a time when India did not want to lose a match to lowly New Zealand. Such pitches were the order of the day and New Zealand were happy to secure a draw. The number of overs bowled tell the story: 176 for 450 runs and 242 for 531 runs. The PQI was a mind-blowing 93.4. The BpW was a staggering 285. I wonder why anyone - me included - would want to go and watch a Test match of this sort.
Next on the list is a high-scoring draw in Lahore in 2006, in which Pakistan scored nearly 700 and India replied with a first-wicket stand of 410. However, no one could say that this was a dull match. Shahid Afridi and Kamran Akmal scored hundreds at better than a run a ball, and Pakistan's run rate was 4.71 an over. Virender Sehwag's 254 was also over a run a ball, and India scored at 5.32 per over. The RpW is a staggering 136. And all this happened in just over two-and-a-half days' play, as the match was marred by rain and bad light.
If that match was a real entertainer, India's Colombo marathon in 1997 was an eminently forgettable one. India scored 537 and Sri Lanka batted nearly three days to reach the innings record total of 952. Rajesh Chauhan and Anil Kumble together conceded one run less than 500. This was the third Test to have a PQI higher than 90.
In Georgetown in 1971-72, only ten wickets fell over five days of play. The RpO was a painfully low 2.24. Glenn Turner batted nearly 12 hours for 259 and his first-wicket stand of 387 with Terry Jarvis lasted nine hours. It took 44 overs to take a wicket - nearly half a day's play.
If nothing else, the next Test on the list contained a world record - Brian Lara's 375 overtaking Garry Sobers' 36-year-old record for most runs in an innings. However, with both West Indies and England making 593 in their first innings, there was no chance of anything other than a bat-athon.
The West Indies-England Bridgetown Test in 2008-09 contains the lone five-wicket performance on this list of matches - by Graeme Swann. The story of the match can be seen from the team totals: England's 600 for 6 and 279 for 2 versus West Indies' 749 for 9, which featured 291 by Ramnaresh Sarwan.
In Faisalabad in 1985-86, Sri Lanka took 200 overs to score 479. Pakistan responded in kind, albeit going a little faster. Two bloody-minded double-hundreds, by Qasim Umar and Javed Miandad, took them to 555 for 3 in 162.5 overs.
Antigua again, West Indies vs Africa this time. It was Chris Gayle who scored a triple in this game; seven other batsmen reached 100.
In Wellington in 1987-88, New Zealand batted for nearly 200 overs and declared at 512. With the last two days lost to rain, the match could only be a dead draw.
The last Test here - in Karachi in 2008-09 - contains two big double-hundreds, by Mahela Jayawardene and Thilan Samaraweera, and a triple by Younis Khan. The combined first innings of both teams lasted more than 400 overs and produced over 1400 runs. But for the loss of a few wickets in the third innings, this Test would have been much higher up on the list.
The average aggregate runs for these ten Tests is 1227, and on average 13 wickets fell in them. The average RpW is 97 and average BpW is 189. Finally, the average PQI value is 88.4.
Now let me provide two alternative tables for the bowler-friendly pitches, ordered by RpW and BpW respectively. If the Test already features on the first table ordered on PQI, the innings scores are not shown.
Six of these ten Tests feature in the PQI table. That indicates there is a fair degree of correlation between the PQI and RpW.
In this grouping, by BpW, five Tests are from the PQI table. Among the other five there is the 2019 Test between England and Ireland. The BpW figure for that amazing match was just over 26. The totals in the second and third innings of the Test exceeded 200 and 300, but the other two innings were under 100.
At the higher end, there is a greater correlation. Eight Tests find their place in both tables - albeit in different positions. Two recent Tests in Sri Lanka come into this list: against India in 2010 in Colombo, with a huge RpW value of 87; Sachin Tendulkar and Kumar Sangakkara scored double-hundreds. And against Bangladesh in Galle in 2012-13, which featured eight hundreds.
In the above table, ordered by BpW, seven Tests from the PQI table find a place. The three new Tests that come in are from the post-war period. One of these is the 1964 Ashes Test at Old Trafford in which both teams crossed 600. Bob Simpson scored 311 and Ken Barrington made 256. The bowlers required more than 30 overs per wicket.
Conclusion
There is no doubt that the pitch for the day-night match in Ahmedabad was a sub-standard one. However, it must be accepted that India won because they batted and bowled better. England's series loss was due to poor management of resources, quirky selection, and lack of consistency. The World Test Championship final will be contested by two well-deserving teams - the teams that took advantage of the opportunities offered. Australia missed no fewer than six opportunities to seal a spot over the past couple of years and England had a poor series in India.
There is no doubt that the pitch for the day-night match in Ahmedabad was a sub-standard one. However, it must be accepted that India won because they batted and bowled better. England's series loss was due to poor management of resources, quirky selection, and lack of consistency. The World Test Championship final will be contested by two well-deserving teams - the teams that took advantage of the opportunities offered. Australia missed no fewer than six opportunities to seal a spot over the past couple of years and England had a poor series in India.
I do not agree with most statements from the players and others who supported the first Ahmedabad pitch. However, I have to agree with Virat Kohli about the fact that ultimately the low-scoring, seemingly poor, pitches offer a result. Two days or three, the quick fall of wickets does lead to a conclusion. Unlike the other type of pitch. There is only one result in the top 65 Tests of the high-PQI value table, the one in which Garry Sobers scored 365. So, on balance, one should prefer the lesser of the two evils, the result-oriented pitches.
It was to India's credit that they qualified for the WTC final. However, it was surprising to see both Kohli and Ravi Shastri strongly protesting the revised WTC rules. Surely they did not expect to play more series than the other contenders and still expect teams to qualify based on aggregate points secured? How would it have been fair to those teams who played fewer series - Australia and New Zealand?
The PQI for the low-scoring two-day Test between Afghanistan and Zimbabwe is a reasonable 34.3. This is mainly because the "expected numbers" for Afghanistan and, to a lesser extent, Zimbabwe, are not that high, and so to say, the low scores are expected. This is compensated to some extent by the better bowling performances of both teams.
The PQI for the fourth Test in Ahmedabad was 38.2. This is a single-PQI match because it was an innings win and the three innings went towards constituting the PQI. It is clear that it was not necessarily a very good wicket with the weight of two sub-par England innings playing a big part. And let us not forget that India were 146 for 6. But it was much better than the strip for the day-night match at the same venue.
Email me with your comments and I will respond. This email id is to be used only for sending in comments.
Anantha Narayanan has written for ESPNcricinfo and CastrolCricket and worked with a number of companies on their cricket performance ratings-related systems