Who is the greatest ODI bowler of all time?
A comprehensive analysis that takes into account era, opposition strength, quality of wickets, big-tournament performances, and longevity
Anantha Narayanan
15-Nov-2020
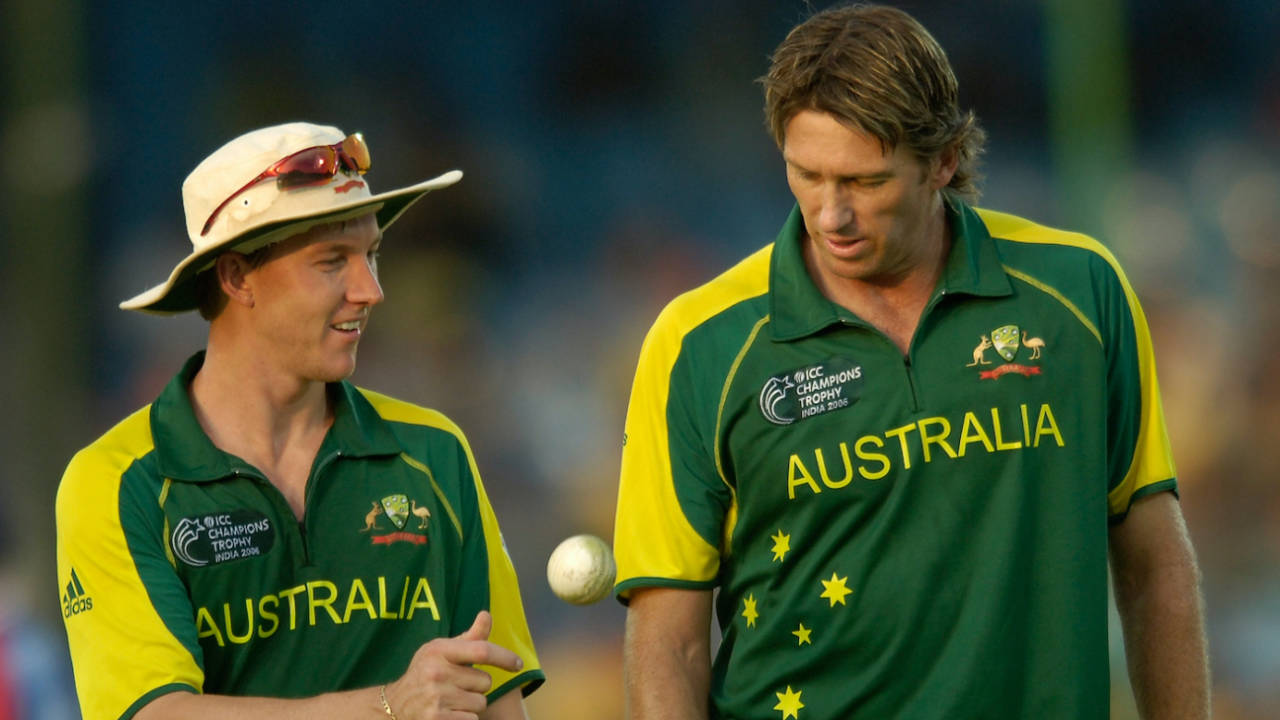
Is it possible to definitively rate bowlers like Glenn McGrath and Brett Lee against those from other eras and teams? • Getty Images
A few months ago I wrote an article on the top ODI batsmen of all time that received many comments. I have used most of the insights gained from that earlier article to structure this article. The article is updated till the third ODI between England and Australia, played on September 16, 2020.
A few points about comments I received on that earlier article.
Though I had allocated only 32.5% for the three accumulation-based parameters (runs, major Cup-related achievements, Weighted Cup Runs) in the analysis of batsmen, even that was felt to be too high by many readers. They felt that the performance parameters should carry a higher allocation. This made a lot of sense.
Readers recognised that winning major tournaments like World Cups is important but felt that the weight allotted to these achievements ought to be reduced.
The allocation of points for Man-of-the-Match awards raised the hackles of many, who thought this overlapped hugely with the Ratings points parameter, which was an accurate and objective determination of the player's performance in a match. The subjectivity in how MoM awards are given out irked many, and the fact that many MoM awards have been given for all-round performances (even at lower levels of each function) concerned a few.
Quite a few readers felt that two parameters, own team's batting strength and own team's bowling strength, were not relevant while determining the best ODI batsmen of all time. They felt, rightly, that a batsman should not be penalised for having a strong bowling group or vice versa.
Many readers felt that the percentage of runs scored by the batsman in a team total ought to find a place in the X-factor category.
Based on all these points of feedback, I have tweaked my model to pick the top bowlers. The idea is to cover virtually all aspects involving ODI bowlers, and to be fair to bowlers across the eras - from 1975, when 19 matches were played, to 2019, when 150 matches were played, both being World Cup years. The key points of difference from the model for batting analysis are summarised below.
The accumulation-based parameter total has been reduced to 20.0. Wickets carry 10 points (down from 15 for runs), major cup-related achievements carry 7.5 points (down from 12.5) and tournament wickets carry 2.5 points (down from 5.0). I hope that with this drastic reduction of longevity parameter weights, most readers will be satisfied.
This means that the total for the performance parameters is increased from 52.5 to 70.0.
The MoM parameter has been removed.
The "own batting" and "own bowling" parameters have been removed. Instead, a few bowling-specific parameters have been introduced. Details of this are in the next section.
The percentage of balls bowled and percentage of wickets taken by the bowler have also been introduced.
I never get tired of comparing the fundamentally unsound batting average and the excellent bowling average. The batting average makes the patently ridiculous assumption that Viv Richards' 189 not out and Kapil Dev's 175 not out should not be counted as innings. Hence I have developed the concept of WBA (Weighted Batting Average). The details can be found here. On the other hand, the bowling average is exactly what it says it is - runs conceded per wicket. There are no red herrings to dilute the metric.
While I could have taken the bowling average as it is for this article, I have always felt that the two components that go into creating the bowling average (RpW) - balls per wicket (BpW) and runs per ball (RpB) - should be treated separately since I think the BpW component should get a higher weight. Any knowledgeable follower of the ODI game will agree that a spell of 10-1-53-4 is almost always better for the bowler's team than a spell of 10-3-25-1, barring special situations where the team is defending a low score. Hence the two components are handled separately. Given below are the parameters and their weights.
Performance parameters (70 points)
1. Adjusted Balls per Wicket (17.5 points)
2. Balls per Wicket peer comparison (specific to bowler's career) (7.5 points)
3. Adjusted Runs per Ball (over) (12.5 points)
4. Runs per Over peer comparison (specific to bowler's career) (5 points)
5. Top-order wickets taken (5 points)
6. Average quality of wickets taken (7.5 points)
7. Weighted quality of batsmen bowled to (5 points)
8. Ratings points (average and best bowling performance) (10 points)
Accumulation parameters (20 points)
9. Wickets taken (10 points)
10. Major tournament performances (7.5 points)
11. Weighted wickets taken in all tournaments (2.5 points)
10. Major tournament performances (7.5 points)
11. Weighted wickets taken in all tournaments (2.5 points)
Miscellaneous parameters (10 points)
12. Spell Wickets Index (2.5 points)
13. Spell Economy Index (2.5 points)
14. Percentage of team balls bowled and percentage of wickets taken (2.5 points)
15. Maidens bowled (number and percentage of overs) (2.5 points)
13. Spell Economy Index (2.5 points)
14. Percentage of team balls bowled and percentage of wickets taken (2.5 points)
15. Maidens bowled (number and percentage of overs) (2.5 points)
These parameters are explained in detail below.
Performance parameters
1. Adjusted Balls per Wicket (17.5 points): This is an absolute-value metric. The raw BpW value is adjusted by a complex process. The bowler's career is separated into appropriate periods and each period's BpW for the bowler adjusted by that period's total BpI for the batsmen and the weighted average determined. Thus, a bowler will get credit if the batsmen in a particular period played longer innings, and lose credit if the batsmen in a particular period played shorter innings.
Wasim Akram's career BpW of 36.2 is adjusted downwards (favourably) to 35.2 because, across his career, batsmen played longer innings than the all-time average (across three periods). Jasprit Bumrah's career BpW of 32.2 is adjusted upwards (unfavourably) to 33.0 because, across his career, batsmen played shorter innings than the all-time average (37.0 vs 37.9). Thus it can be seen that the two BpW figures of two bowlers who bowled 35 years apart have been rationalised and are comparable.
2. BpW peer comparison (specific to bowler's career) (7.5 points): This is a comparison metric. The bowler's BpW figure across his exact career is compared to the BpW of all bowlers who are or were his contemporaries and the percentage value arrived at. Points are allotted based on this percentage value.
3. Adjusted Runs per Ball (over) (12.5 points): This is an absolute-value metric. The raw RpO value is adjusted by a complex process. The bowler's career is separated into appropriate periods. Each period's RpO for the bowler is adjusted by that period's total RpO for the batsmen and the weighted average determined. Thus, a bowler will get credit if the batsmen in a particular period scored quickly, and lose credit if the batsmen in a particular period scored slowly.
Joel Garner's career RpO of 3.10 is adjusted upwards (unfavourably) to 3.58 because, across his career, batsmen scored slower than the all-time average (3.90 vs 4.51). Rashid Khan's career RpO of 4.16 is adjusted downwards (favourably) to 3.71 because, across his career, batsmen scored quicker than the all-time average (5.05 vs 4.51). Thus it can be seen that the two RpO figures of two bowlers who bowled 30 years apart have been rationalised and are comparable. Khan stands quite close to Garner.
4. RpO peer comparison (specific to bowler's career) (5 points): This is a comparison metric. The bowler's RpO figure across his career is compared to the RpO of all bowlers who are or were his contemporaries and the percentage value arrived at. The points are allotted based on this value.
5. Top-order wickets taken (5 points): This is a combination metric of both absolute and comparison values. The number of top-order batsmen dismissed is the absolute value used; 2.0 points are allotted for this. The percentage of top-order wickets to career wickets is a comparison value; 3.0 points are used for this. This is to reward the bowlers who dismiss Andy Flower and Babar Azam as compared to those who dismiss Pommie Mbangwa and Shaheen Afridi.
6. Average value of wickets taken per spell (7.5 points): (A spell, for the purpose of this analysis, is all overs bowled in an innings.) This one is a pure performance metric. The value used is the average value of wickets captured per spell, considering the career-to-date WBA of the dismissed batsmen and the runs saved, if any (if the batsman was dismissed before his score reached his mean RpI). In summary, this is to reward bowler A who dismissed Virat Kohli for 5 as against bowler B who dismissed Kohli for 100 as against bowler C who dismissed Bumrah. A spell is taken as the base, rather than the wicket, in view of the importance of a spell to the match result.
7. Weighted quality of batsmen bowled to (5 points): This metric reflects the average quality of batsman the bowler bowled to. In order to give it an adrenaline shot, I multiply the wickets captured by the quality of the batsmen (a composite of BpW and SR), sum the values and get the average value per wicket. This would ensure that a seven-wicket haul against Namibia will be put in its place and to reward bowlers who bowl successfully to the might of Australian batting machine as against those who do well against Zimbabwe.
8. Performance Ratings Points (average and best bowling performance) (10 points): This is also a pure contribution metric. Average Performance Ratings points per innings are given 7.5 points and 2 the best-rated performance of the bowler is given 2.5 points.
Accumulation parameters (20 points)
9. Wickets taken (10 points): Self-explanatory. However, by giving this longevity parameter only 10 points, its impact has been reduced considerably. The difference in points between a player who takes 500 wickets and another who takes 100 is only around 7 points, which can easily be (and has been) made up in the performance areas.
10. Major tournament performances (7.5 points): This is similar to the parameter for top batsmen, except that this receives a lower weight. In brief, the bowlers get points based on their team's results in major tournaments and get points based on the total. The tournaments considered are:
- World Cups (12)
- ICC Champions Trophy (8)
- Tournaments in which a minimum of six teams participated (6)
- World Cups (12)
- ICC Champions Trophy (8)
- Tournaments in which a minimum of six teams participated (6)
11. Weighted wickets taken in all tournaments (2.5 points): In this case, I consider all the wickets taken by the bowler in key knockout matches. Each spell is weighted by the match importance index, with a maximum of 150% for the World Cup final. The overall summary is below.
Many of the group matches are inconsequential (India-Namibia, South Africa-Canada, England-Netherlands in the 2003 World Cup, etc). However, it is difficult to exclude any match since there is the chance of a surprise elimination (India in 2007, South Africa/Pakistan in 2003, etc). A total of 31 non-Test playing teams (as at the time of each World Cup) have played. The 2019 edition is the only World Cup in which all participating teams were Test-playing countries. To a lesser extent, these are applicable to the other two major tournaments also.
Miscellaneous parameters (10 points)
12. Spell Wickets Index (2.5 points): This is to recognise the overall value of wicket-taking spells. Only spells in which three or more wickets are taken are considered. A simple weighted valuation of spells, classified into three categories, is applied to determine this value.
13. Spell Economy Index (2.5 points): This is to recognise the overall value of economical spells. Only spells in which the bowler's economy rate is below 83.3% of the team's economy rate are considered. A simple weighted valuation of spells, classified into three categories, is applied to determine this value.
14. Percentage of team balls bowled and wickets taken (2.5 points): Simple base values of percentage of team balls bowled and percentage of team wickets taken are used to determine this value. Often, a bowler carries more than 20% of the team's load. The two components are given equal weight (1.25 points each).
15. Maidens bowled (number and percentage of overs) (2.5 points): This is a combination metric of both absolute value and comparison value. The number of maidens bowled is the absolute value used; 1.0 point is allotted for this. The percentage of maidens to career overs bowled is a comparison value; 1.5 points are used for this.
Let us now move on to the main tables. All base performances refer to the adjusted values. The qualification criterion is 100 ODI wickets; 152 bowlers qualify.
Glenn McGrath is the best ODI bowler of all time. He achieves this feat despite being 150 wickets behind Muttiah Muralitharan. This is mainly because McGrath's performance figures are extraordinary: outstanding base values - a BpW figure of 34.1 and RpO of 4.01 (leading to an average of 22.80) have helped him achieve this feat. McGrath tops on only one metric - the Major Cups parameter (mainly because he played in three World Cup wins). However, he is in the top group on almost all parameters - there is no parameter on which he has a low valuation.
Muralitharan is in a very well-deserved second place. There is no doubt that his 531 wickets helped him a lot. However, he would not have got to second place without being excellent in the base performance values - a BpW of 35.5 and RpO of 4.02 (leading to an average of 23.75). He has taken many important tournament wickets. Like McGrath, there is no parameter on which Muralitharan has a low valuation. One could argue he is below par in the maiden-overs value, but that is a reflection of the times he bowled in.
Akram, the master swing bowler and the winner of many battles for Pakistan, stands in third place. His figures are virtually identical to Muralitharan's. His base values are a BpW of 35.2 and RpO of 4.21 (leading to an average of 24.68). Being an attacking bowler, he suffers only in the maidens section.
Brett Lee is in a surprisingly high position, just behind Akram. He has an excellent strike rate - a BpW of 30.1 and RpO of 4.68 (leading to an average of 23.48). A true match-winner, almost always bowling at top pace.
I am very happy at the fifth place secured by Garner. This shows that the ratings process is sound. If a bowler with just 146 wickets can outshine many with double his tally, then I am confident that we have captured the essence of bowling dynamics very well. This despite Garner's base figures being adjusted upwards - a BpW of 34.9 and RpO of 3.58 (leading to an average of 20.79). His career average was 18.85. Note how highly Garner is placed on the ratings points parameter. He leads in no fewer than four parameters, including three performance measures.
I am equally pleased at the sixth-place finish of Mitchell Starc, despite a low haul of 183 wickets. However, the base values tell a compelling story - a BpW of 20.6 and RpO of 4.57 (leading to an average of 20.62). His adjusted average is the best of all bowlers. A very aggressive bowler, bowling to take wickets always. He has conceded runs but that, again, is a reflection of the times. He leads on three parameters, including two performance measures.
The top 11 is rounded off by a quintet of excellent pace bowlers - Chaminda Vaas, Shaun Pollock, Shane Bond, Trent Boult and Waqar Younis - a magnificent pace bowler who never bothered about the runs he conceded. He also got next to nothing on the Major Cups front. Boult is grossly underrated. Khan's 14th place, with a mere 133 wickets, is a tribute to the feisty legspinner, whose average is an astounding 16.97. Let no one talk about his bowling to weaker teams. The extensive range of parameters has taken care of that. And let us not forget that unlike Bumrah and Starc, who have powerful batting machines behind them, Khan does not have great support. His case is similar to that of Muralitharan in the first third of his career.
Australia dominate the table with six entries - three in the top ten and three in the next ten. Sri Lanka and Pakistan have three entries each.
The high parameter values and the associated metric values are shown below.
Garner leads on three parameters and Starc on two. Despite a significant increase in Garner's RpO figure, he leads comfortably there. Starc's BpW figure is phenomenal. Garner's 5 for 38 in the 1979 World Cup final was rated seventh in my all-time best bowling performances table. Muralitharan's top-order wickets score is a tribute not just to the many wickets he took but also the percentage share of those wickets. Two modern giants, Boult and Kagiso Rabada, lead on one parameter each.
Muralitharan and McGrath share the top spots on the accumulation criteria. But it must be seen that the advantage they gain because of these placements is not very high, since only 20 points are available for allocation here. McGrath's three World Cup wins have helped him. Across many tournaments, Muralitharan has performed wonderfully well.
Starc and Garner take the top places on the spell-related parameters. Correctly, Rashid Khan is on top of the percentage-of-team-bowling parameter. In terms of bowling and taking wickets, he does more than his share of work. Finally, a tribute to the accuracy of Richard Hadlee, who leads on the maidens-bowled parameter. His numbers are unbelievable, even if you concede that most batsmen of his era considered ODIs a shortened form of Test matches.
The table above summarises the three main groups. Starc leads the performance group, closely followed by Shane Bond and Khan. Muralitharan leads in the accumulation group, followed by McGrath and Akram. Garner is the standout leader in the miscellaneous group. This has helped him bridge the gap because of points lost in the accumulation group.
The bowlers who stand out on the performance values are Starc, Garner, Bond and Khan. They have secured above 52 points (out of 70). However, this does not mean that an accumulation wizard like McGrath is lagging behind. He has 51.8 points. Look at the high quantum of points for Lee and Boult.
The accumulation table goes as per the overall numbers. McGrath and Muralitharan are the only two bowlers to accumulate over 15 points (out of 20). Akram is just behind. However, look at the low accumulation of points by modern greats like Starc, Bond, Boult and Khan. It is amazing how they have still managed to get into the overall all-time top 20.
The miscellaneous table sees Garner stand out, way ahead of the others. He is followed by McGrath and Bond. Michael Holding, Shaun Pollock and Khan come in with excellent numbers.
Conclusion
In conclusion, let me say that most of the problems raised by the readers in response to the article on top batsmen have been addressed here. McGrath and Muralitharan are on top, helped by their accumulation figures, but mainly because they have excellent performance figures. Akram is not far behind. This methodology has also allowed the great bowlers across the years - Garner, Starc, Khan, Bond, Boult, etc - to force their way into the top ten despite taking below 200 wickets apiece. So the system used has been strong on the side of the performance parameters, while at the same time giving reasonable credit for accumulation parameters. I can say that no bowler of repute is missing from the top 20. The next five bowlers are Bumrah, Saeed Ajmal, Makhaya Ntini, Ajantha Mendis and Damien Fleming.
In conclusion, let me say that most of the problems raised by the readers in response to the article on top batsmen have been addressed here. McGrath and Muralitharan are on top, helped by their accumulation figures, but mainly because they have excellent performance figures. Akram is not far behind. This methodology has also allowed the great bowlers across the years - Garner, Starc, Khan, Bond, Boult, etc - to force their way into the top ten despite taking below 200 wickets apiece. So the system used has been strong on the side of the performance parameters, while at the same time giving reasonable credit for accumulation parameters. I can say that no bowler of repute is missing from the top 20. The next five bowlers are Bumrah, Saeed Ajmal, Makhaya Ntini, Ajantha Mendis and Damien Fleming.
Email me with your comments and I will respond. This email id is to be used only for sending in comments.
Anantha Narayanan has written for ESPNcricinfo and CastrolCricket and worked with a number of companies on their cricket performance ratings-related systems