Why Steven Smith's 2019 Ashes batting performance is the greatest of all time in a series
The best batting, bowling and all-round performances in series, ranked, taking into account opposition strength and the pitch conditions
Anantha Narayanan
10-Oct-2020
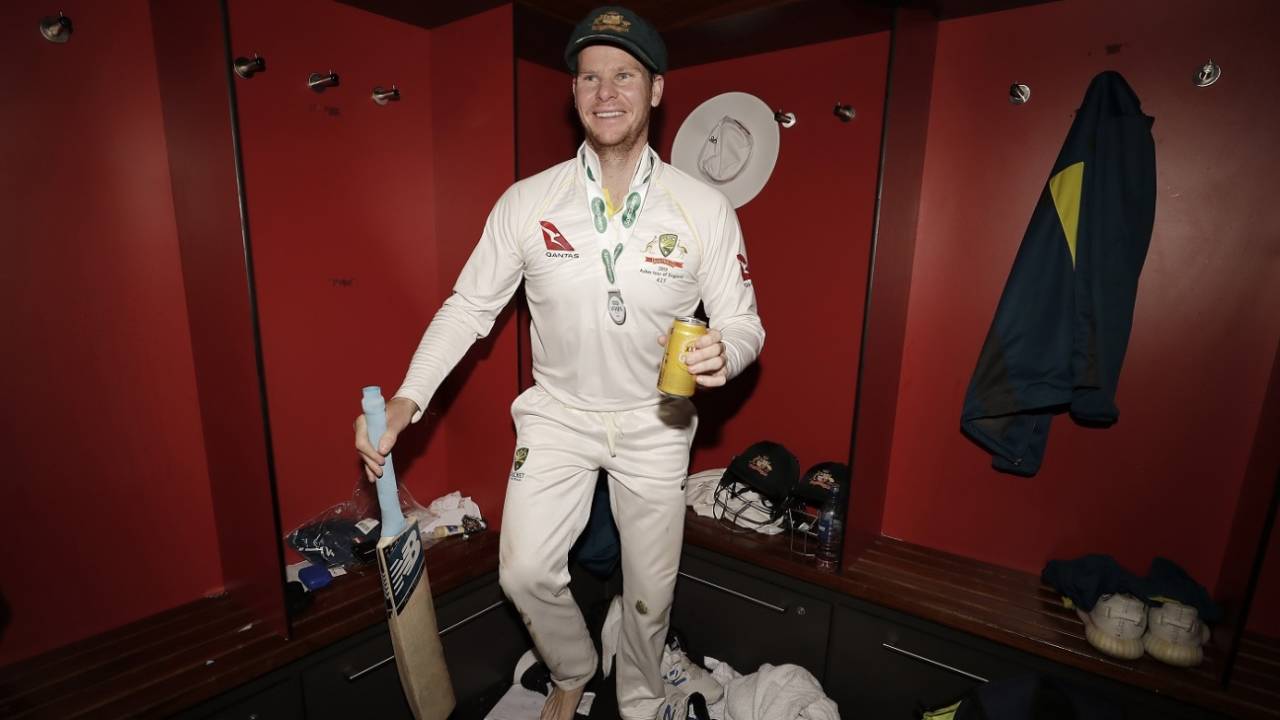
Might Steven Smith finish his career a clear second only to Bradman? • Getty Images
This article is about the top performers, both batsmen and bowlers, in Test series. I can already hear voices clamouring, "Come on, I can go to ESPNcricinfo's stats section and see that Don Bradman's 974 runs in the 1930 Ashes and Sydney Barnes' 49 wickets in the 1913-14 South Africa series are the best batting and bowling performances in a series. What are you going to do differently?" A very valid plaint indeed. These tables can be obtained at a minute's notice.
However, I will bring context into the equation. Where was the series played, who were the opponents, how strong were the opponent bowlers and batsmen, what was the innings and match status when the players played, what was the result, what was the support available, and the like.
In other words, I will bring into the equation Performance Ratings points. Just as Kusal Perera's and Brian Lara's unbeaten 153s were placed far ahead of Lara's 400 in the batting ratings, it is possible that lower run and wicket aggregates could trump the colossal performances of Bradman and Barnes. In fact, I can say that the two performances referred to above are nowhere near the best ever.
Let us start with the batsmen. First, a table on the best batting performances in a series - ordered by batting rating points.
Steven Smith's epochal feats in the 2019 Ashes series add up to the best ever series batting performance in the history of the game. He gathered 3427 rating points, which works out to over 800 points per Test (he missed one match with a concussion). He failed in one innings out of seven. The runs were scored when needed, and they helped Australia draw the series. In two Tests he delivered big performances in each innings, and he made excellent big fifties in the other two.
Clyde Walcott's magnificent series in 1955 against the strong Australians comes in in second position. He scored five hundreds in the series - the only batsman in history to do so, and his rating points tally was 3185. A young Mark Taylor, in only his second series, took England by storm in 1989 with an aggregate of 839 runs, with over 2850 rating points. A century, double-century and a bunch of fifties helped him achieve this remarkable feat, which gives him the fourth position. Rounding out the top five is Virat Kohli, who, after a disastrous 2014 in England, more than made up in 2018. His two priceless hundreds and consistent scores helped him gather 2805 rating points.
Len Hutton's landmark series performance in 1950-51 merits a separate paragraph. An aggregate of 533 runs in a low-scoring series, and nearly 2900 rating points, puts this performance in third place. That too in a lost series. Let us look deeper at the numbers from the series. One of the greatest bowling combinations ever (Ray Lindwall, Keith Miller, Bill Johnston), an average Pitch Quality Index of just over 40 (the lowest amongst all considered series). It is no wonder that Hutton ranks so high on the list. It also proves that the ratings basis is sound - the process does not reward wins and run aggregates undeservedly, especially when it comes to low-to-middling scores. Hutton's 62 not out, coming in at 30 for 6, gathered over 500 rating points.
The rest of the list reads like a Who's Who of top Test batsmen. All these players have secured in excess of 2500 rating points in each case. Mohinder Amarnath deserves a special mention. After one of the greatest series by a visiting batsman, against West Indies away, he had the mortification of scoring 4, 7, 0, 0, 1, 0, 0 and 0 - and at home at that.
Now on to the secondary metric of rating points per run. A high value of this indicates a tough series and a low one, a rather friendly one. Hutton had the highest value, 5.4 points per run. Allan Border in 1981 is the only other batsman to exceed 5.0. Smith's value is rather high, 4.4. Bradman's 1930 average is the lowest at 2.6.
Why is Bradman, with his aggregate of 974 runs in 1930, only in 21st place? Well, it is time to look at some aspects of the ratings computations.
1. Merely scoring runs will not guarantee ratings points. Just as the brace of 153s trumped 365 and 400, many series aggregates in the 500-600 range will get more ratings points over much higher 800-run aggregates. The main reason for this is context, which has already been covered. And the second reason is that I have made sure the ratings values are not overly linearly dependent on the scores.
2. For the 49,366 innings of 10-plus runs in Test history, the correlation coefficient between runs and rating points is 0.90. That is very good correlation but not absolute dependency.
3. Take three batsmen playing in a three-Test series. The first one scores two 300s, the second one, three 200s, and the third four 100s. Other things being equal, the first batsman is likely to secure 1500 rating points, the second one, 1800 points and the third batsman over 2200 points.
4. Well-made small innings get a significant number of points. A tough 75 in a hard-fought team score of 200 is likely to carry more points than a 150 out of 700. However, this does not mean that all low scores will get good points. Aravinda de Silva's 125, made coming in at 615 for 1 does not even get 200 rating points.
5. The base numbers of the series mean a lot. For instance, Bradman's 1930 series had an average Pitch Quality Index of 57, indicating a relatively batsman-dominated series. Smith's 2019 Ashes was much more bowler-friendly, with an average PQI of 46.
6. Bradman's scores in that 1930 series against England were 131 (L), 254 (W), 334 (D) and 232 (W). Four substantial innings, but his three other innings, were 8, 1 and 14. Not necessarily good for ratings points accumulation, or for that matter, of great value to the team. Smith scored 144 and 142 (W), 92 (D), 211 and 82 (W) and 80 (L). The only other innings was one of 23. So there was almost no poor innings.
Finally, scoring big innings only guarantees that the team will not lose. Not necessarily win. Of the 94 scores of 250 or more, only 45 have resulted in wins and 49, in draws. It is no wonder that Bradman accumulated 2517 rating points and Smith 3427.
The ratings points are already a qualitative metric. A doubly qualitative one is the ratings points per Test. This is the ultimate measuring tool. Smith played in only four Tests in the 2019 series and averaged over 850 points per Test. That is an average of one innings fit to make the top 25 innings of all time in each Test he played in. The next batsman on this parameter is Sunil Gavaskar in the 1971 tour and he is exactly 200 points behind. The only other batsman who averages more than 600 points per Test is Walcott.
Going down to two-Test series, Dimuth Karunaratne averaged 851 points per Test against South Africa in 2018. Jacques Kallis averaged 787 points against Pakistan in 2007. Ajinkya Rahane averaged 761 points against West Indies in 2019. Jimmy Adams and Brian Lara exceeded 750 points per Test in three-Test series against India in 1994 and Sri Lanka in 2001 respectively.
The list above is the table you can get in a minute from ESPNcricinfo. Bradman and Wally Hammond are the only two batsmen to score more than 900 runs in a Test series. Bradman has also topped 800 on two other occasions, while Taylor, Neil Harvey, Viv Richards, Walcott and Garry Sobers have also exceeded 800 runs in a Test series. Maybe this target is unattainable now with the number of Tests in a series coming down.
However, I have provided another measure, a partly qualitative one, at the left. This is the Runs per Test value. Graham Gooch is the only batsman to exceed 250 runs per Test in this group - against India in 1990, but in a three-Test series. Richards is the other batsman to exceed 200 runs per Test. Smith crossed 190 twice. Because of six-Test series, the average drops to around 125 for some batsmen.
When we come down to two-Test series, Sanath Jayasuriya averaged 285.5 against India in 1997, Hammond 281.5 against New Zealand in 1933, and Andy Flower 270 against India in a tough away series during 2000.
I had prepared an additional chart ordered on Rating points per Test. I decided not to include the same. That graph would have done justice to the 2/3 Test series. Unknowingly, I have not been fair to the smaller countries which normally play 2/3 Test series. Hence I have included the same here. The graph is self-explanatory.
Finally, a scatter chart to show the way the batsmen performed on the two measures - rating points and runs scored.
Smith in 2019 is only in the middle on the runs-scored axis but is way up on the ratings-points axis. Bradman is way to the right on the runs axis and fairly low on the ratings-points one. Of special interest are Hutton and Border. They are way to the left on the X-axis but in the middle in the Y-axis. The diagram is, on the whole, self-explanatory.
Now for some points about the bowling ratings.
1. For the 29,876 wicket-capturing spells in all Test cricket, the correlation coefficient is 0.96. This is very high degree of correlation, indicating a very strong relationship between wickets and rating points.
2. Unlike runs, which could mean nothing, wickets matter a lot almost always. There is a clear distinction between a batsman scoring an utterly useless hundred in a score of 700 in a drawn match and a bowler taking, say, three wickets in a match with a very low PQI of 10. In the latter case, invariably the team wins.
3. The bowling rating scores, on average, are higher than for batting, since the total points are shared by fewer bowlers.
4. Finally, taking, say, eight wickets, not only increases the chances of a result but also the chances that it is a win. Of the 97 eight-wicket performances, 63 have resulted in wins, 12 in draws, and 22 in losses.
In summary, this is a recognition of the century-old saying that bowlers win matches.
Jim Laker's colossal collection of 46 wickets in that mesmerising series against Australia in 1956 walks away with the best-bowling-performance laurels. It came against an Australia team that was not poor by any means - Colin McDonald, Neal Harvey, Keith Miller, Richie Benaud, Alan Davidson and Ray Lindwall formed a tough group of players. It was a bowling-centric series, where the average Pitch Quality Index was around 42. Laker's wicket hauls were 10, 9, 6, 5, 4, 4, 3, 3 and 2.
Next comes one of the greatest bowling performances by any bowler in Asia. When Imran Khan took 40 wickets against India in 1983, he set standards unequalled before or after. He gathered 4354 rating points because he dismissed many top-order batsmen. The fewest wickets he took in any innings in the series was two. He had four five-wicket hauls.
In third place is Terry Alderman, whose twin golden series in England represent, arguably, two of the greatest bowling performances in that country. This particular entry is for the latter one - in the 1989 series. The 41 wickets he took gave him 4278 rating points. Alderman too dismissed many top-order batsmen. His two Ashes performances, eight years apart, were magnificent landmarks. However, his 1989 performance, though it was lower by one wicket than the 1981 one, earns 10% more rating points because Australia won 4-0 in 1989, as against losing 1-3 in 1981; the bowling average was 17 in 1989, against 21 in the earlier series; and Alderman dismissed 33 top-order batsmen in 1989 as compared to 26 in 1981.
In fourth place lies Clarrie Grimmett's farewell series performance of 44 wickets in 1936 against South Africa. South Africa were not a great team in those days, but the huge number of wickets helped Grimmett gather in excess of 4200 rating points. Let us not forget that he was past 40 at that time.
In fifth place is Maurice Tate's 38 wickets on his first visit to Australia, in 1924-25. Bradman was still practising at home in Bowral then, but this Australian team was quite a strong one, and Tate's aggregate was well over 4000 rating points.
In sixth place is Barnes' haul of 49 wickets in four Tests against South Africa in 1914. However, it is clear that the South Africa team was a sub-par one, and this accounts for Barnes' rating-points tally being only 4063.
On the ratings-points-per-Test measure, Barnes deservedly leads, having earned his 4000-plus points in that series from only four Tests. He is the only player to exceed 1000 points per Test in this group. Laker, Grimmett and Tate accumulated over 800 points per Test.
Moving to two-and-three-Test series, Saqlain Mushtaq averaged 1077 points per Test against India in 1999. Muttiah Muralitharan earned 1061 points per Test against South Africa in 2006. Richard Hadlee and Rangana Herath averaged either side of 1050 points per Test, in three-Test series, against Australia in 1985 and Australia in 2016 respectively. These four, along with Barnes, are the only bowlers to go past 1000 points per Test.
Harbhajan Singh (2001 versus Australia), Nathan Lyon (2017 versus Bangladesh) and Mohammad Asif (2006 versus Sri Lanka) narrowly miss out.
Considering that it was played in Pakistan, the opposition was a strong Indian team, and that the series was a batsman-dominated one (average Pitch Quality Index of 60), I would venture to say that Khan's performance was the best ever in a series. The other bowlers in contention bowled in bowler-friendly conditions and/or against weaker opposition.
Barnes leads the list of top wicket-takers, with 49 wickets in the series against South Africa in 1914. The fact that it was against rather ordinary opposition does not lower the greatness of the performance. Laker, Grimmett, Alderman (twice), Rodney Hogg, Shane Warne and Khan took 40 or more wickets in a series.
When we come to wickets per Test, Barnes leads again, with over 12. In a three-Test series against South Africa in 1896, George Lohmann averaged 11.67 WpT. Laker is the only other bowler to exceed 9 WpT.
Going down to two-or-three-Test series, a host of bowlers have WpT figures of 10 or more. Possibly the most impressive is Hadlee, who averaged 11 WpT against Australia in 1985. Muralitharan averaged 11 WpT in a two-Test series and 10 WpT in a three-Test series. Singh averaged 10.67 WpT against Australia in 2001. Abdul Qadir averaged 10 WpT against England in 1987.
And just as for the batsmen, the above graph lists the bowlers with the highest ratings points per Test.
Finally, the composite chart, plotting the wickets versus the bowling rating points. Quite different to its counterpart for batting. If I draw a line across, from (30, 3000) to (50, 4500), only one of the top series performers, Barnes, is clearly to the right of the line. That indicates that he gathered fairly average points per wicket - below 100. Many of the bowlers in the left and top have a value of over 100 on this parameter. Two aspects stand out. Barring Khan, no bowler from the subcontinent is in this elite collection. And Barnes, Alderman and Warne have two performances each.
The selection criteria for the allrounders list is that the player should have secured a minimum of 1000 rating points in each of the two aspects, batting and bowling. This is to ensure that true allrounders are selected.
Ian Botham picked up 34 wickets and scored 399 runs in that roller coaster of an Ashes series in 1981. These numbers, individually, would be enough for a player to be considered as having done well either as a batsman or bowler. Botham was off-colour in the first two Tests, when he was the captain. Then he contributed with both bat and ball in the next four Tests - 50, 149 not out and 118, accompanied by 6 for 95, 5 for 11, 3 for 28, 6 for 125 and 4 for 128. All these were match-winning or match-saving performances.
Aubrey Faulkner was a magnificent allrounder, not often talked about but very effective all the same. He was at his best against England in 1910, scoring 545 runs and taking 29 wickets. His key contributions were 78, 123, 47, 76, 44, 49 not out and 99. The bowling contributions were 5 for 120, 3 for 40, 6 for 87, 4 for 89 and a brace of three-wicket hauls. South Africa defeated a strong England side 3-2 mainly because of Faulkner's exploits.
Andrew Flintoff's performances during the Ashes series of 2005 were reminiscent of Botham's two and a half decades before. He made 402 runs and took 24 wickets; that England carved out a narrow 2-1 win in one of the greatest ever Test series was because of Flintoff. Scores of 68, 73, 46, 102 and 72 were supported by bowling spells of 3 for 52, 4 for 79, 4 for 71 and 5 for 78.
George Giffen, with 34 wickets and 475 runs is fourth on the table. This performance was in the lost Ashes series of 1895. Garry Sobers had a batting-dominated series in 1966 against England. He took 20 wickets but scored 722 runs. West Indies won the Test series comfortably.
Sobers appears three more times and Botham twice more on this list. The last two entries are two modern greats - Shakib Al Hassan and Daniel Vettori - both in two-Test series.
Finally, a summary. Which three players are on top?
Steven Smith: Arguably the greatest of modern Test batsmen, and again arguably, the greatest batsman born after 1910. Where will he end his career? No one can bet against a 65 average and a clear second position to the Don.
Jim Laker: One of the most effective spinners of all time. Normally excluded when talks veer around to Warne and Murali. However, no one can deny the impact of the numbers at a time when the frequency of Tests was quite low - 193 wickets at 21.25, well below a typical spinner's bowler's average.
Ian Botham: Inarguably, the most charismatic of allrounders. He was the original. A true match-winner in both aspects of the game.
Email me with your comments and I will respond. This email id is to be used only for sending in comments.
Anantha Narayanan has written for ESPNcricinfo and CastrolCricket and worked with a number of companies on their cricket performance ratings-related systems