Did Kapil Dev really end his career as poorly as people believe he did?
A look at how players did in the last 10% of their careers compared to the first 90%
Anantha Narayanan
12-Sep-2020
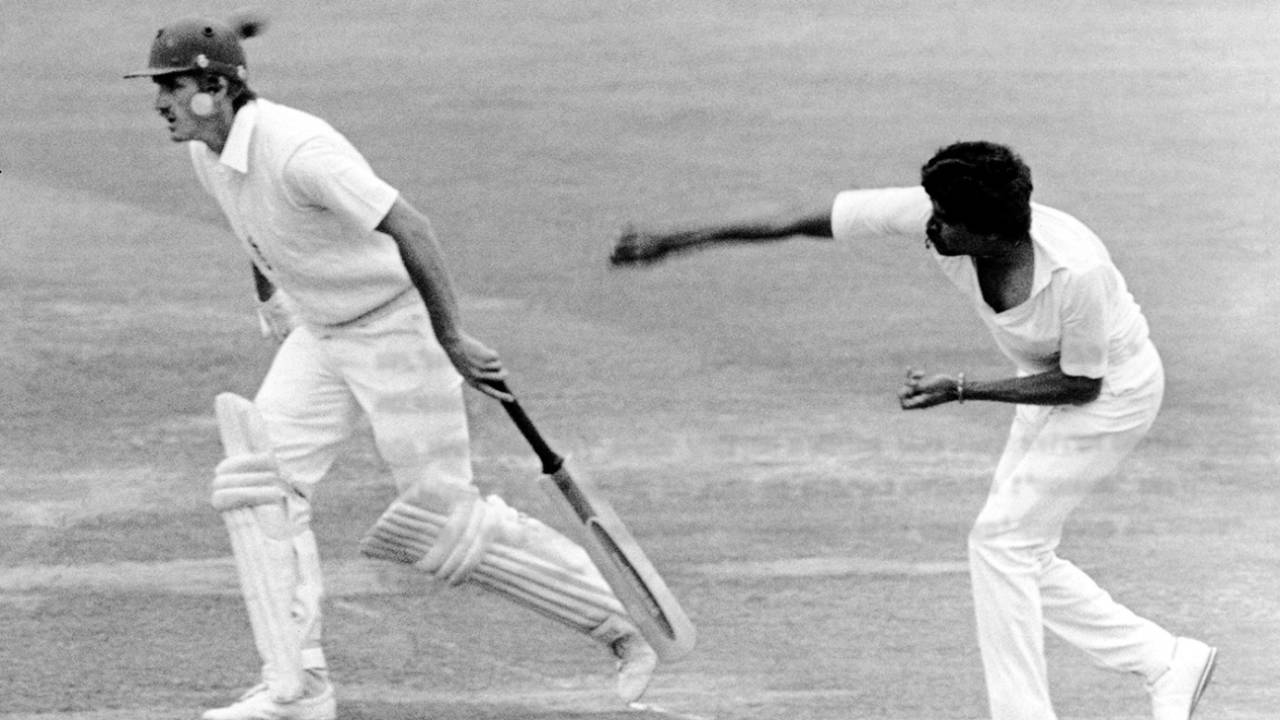
Kapil Dev's economy rate was decent toward the end of his career, and his average better than it was earlier • PA Photos/Getty Images
A few years ago I analysed the careers of players in two different ways. In the first, I split a career into thirds and looked at how players started, consolidated and finished, focusing on how careers progressed but not so much how they ended. In the second, I also analysed how players finished. But because I took a fixed length of ten Tests as the last stage, it was not very conclusive: ten Tests represent 37% of Sydney Barnes' career, 27% of Clarrie Grimmett's, and 5% of Sachin Tendulkar's. In earlier eras, a player might have taken four years to play ten Tests, but now that could happen in six months - albeit in a Covid-free world. I also used the batting average, with all its shortcomings, in those analyses, which resulted in distortions because the not-out patterns vary drastically across career stages. And finally, the analyses included all players who were active back then.
I look to address these problems in this definitive analysis. I have used the weighted batting average (WBA) instead of the conventional batting average to appraise long careers fairly. To ensure that active players are not part of this study, I have excluded any player who has played a Test since the start of 2019. I have worked out a flexible end-stage determination based on the number of Tests played by the player, so that players across all cricket eras are treated fairly and equally.
What is the end stage? I have analysed the careers of many players, whose careers range from 30 to 200 Tests. For one player, ten Tests are too many and for another too few. Maybe for the middle lot, ten is fine, but the method should be fair to Barnes and Tendulkar and everyone in between.
Anything above 10% seemed to be too long a winding-down period for recent players. Anything below 10% seemed to be too short a period for the earlier players. So I decided on 10% as the end stage for a player, subject to a minimum of five Tests. This tweak will take care of bowlers like Barnes and Grimmett. I also want to set the bar high so that we only have players who have played in a significant number of Tests. So I have set 6000 runs as the minimum cut-off, with one exception - Jack Hobbs, who had 5471 runs. I have also set 189 wickets as the cut-off for bowlers, so I can get Barnes in. There are very good reasons why these two all-time greats should be included. In a near-symmetry, I have 61 batsmen and 65 bowlers who qualify.
The batsman end-stage ratio is computed by comparing the end-stage WBA to the WBA at the 90% stage. The 90% stage bowling average for the bowlers is compared to the end-stage bowling average. I have an additional set of graphs for the WpT (Wickets per Test) metric. For this, I divide the end-stage WpT by the 90% stage WpT.
I have decided that any end-stage ratio below 75% represents a poor finish, between 75 and 100% a good finish, and above 100% a very good finish. I feel these are fair values since it is expected that players tend to slow down as they approach the end of their careers and performing at, say, 80% is fine and par.
Let us now move on to the graphs. I will cover only the key players and readers should peruse the graphs carefully to derive their insights. The graphs contain all required information.
One of the all-time great cricketers, an opening batsman par excellence, has had the worst end of all batting careers. Len Hutton's last eight Tests were a nightmare and he had a WBA of 22, bringing down an excellent 55-plus WBA to 52. His sequence of scores was 0, 14, 5, 4, 13, 30, 28, 12, 42, 80, 5, 6, 11, 3 and 53. Sanath Jayasuriya, Matthew Hayden, Hobbs and Virender Sehwag all had very poor endings, hovering at WBA values around 50%. The shrewd reader might have noticed that these are all openers. Dilip Vengsarkar scored four fifties in his last 25 innings. Jayasuriya scored two fifties in his last 28 innings - one of which was in his final innings, 78.
What follows is a who's who of top batsmen - Gundappa Viswanath, Garry Sobers, Tendulkar, Don Bradman, Viv Richards, Wally Hammond, Ricky Ponting, Alastair Cook and Kevin Pietersen. The mind boggles. All these players had end-stage ratios of around 60-70%. Tendulkar's WBA dropped from 51.4 to 49.5; he scored seven fifties in 33 innings. Bradman's WBA fell from 93 to 89.6; he scored two hundreds in his last five Tests. His penultimate innings was 173 not out, one of the greatest chasing innings ever. But his stratospheric WBA value puts him, somewhat unfairly, in this group. Richards moved from 49.3 to 47.5.
But let me give credit to Bradman, who had an end-stage WBA of 60.7 and Hammond, who ended with 38.5. These are excellent values for anyone else, but fall sort when compared to these players' own high performance figures.
Geoff Boycott, Younis Khan, Rahul Dravid and Shivnarine Chanderpaul are in the 75-85% group. Their WBAs dropped by around 1. Brian Lara, Mahela Jayawardene, VVS Laxman, Allan Border and Jacques Kallis are the leading batsmen in the next segment - those who performed at around 85-95%. Their WBA values did not drop a lot - maybe by fractions of a run. They ended their careers in a reasonable manner. Lara scored a double-hundred and a century in his last three Tests.
Lara, Jayawardene, Kallis, Clive Lloyd and Greg Chappell had very good WBA values of 42-plus.
Now we come to those who ended their careers in varying levels of glory - all of them outperforming their 90%-stage values; Sunil Gavaskar and David Gower, just about. Everyone knows what a good ending Gavaskar had. His end period included two hundreds and two nineties. Aravinda de Silva, Mark Taylor, Steve Waugh and Kumar Sangakkara outperformed their 90%-stage values by around 110-120%. Readers might remember that in my article on ODI streaks, I talked about how Sangakkara ended his ODI career with four hundreds in five innings. In the Test arena, Sangakkara's last few Tests had a triple, two doubles and two hundreds. Some ending in both formats!
Stephen Fleming ended in a blaze - 139%, and Gary Kirsten with 144%. Fleming was helped by his 262 against South Africa while Kirsten had three hundreds in his last ten Tests (but finished with scores of 1, 1 and 1).
Three bowlers - Graham McKenzie, Ian Botham and Erapalli Prasanna - ended their careers with end-stage bowling averages that were twice those of the ones at the 90% stage. That is some fall. McKenzie's average was an unbelievable 85. Graeme Swann, Wes Hall, Waqar Younis, Bishan Bedi, Allan Donald, Ray Lindwall, all them finished with averages well over 150% of their 90% stage values. Muttiah Muralitharan also did not end that well, although one must say that his end-stage average of 31 is not too bad.
This drastic drop in form does not seem to have any pattern. It affects spinners and fast bowlers alike. However, one country seems disproportionately affected - India. All the Indian bowlers who meet the qualification, barring one, have finished poorly. Maybe Indian bowlers do not quit when they are still doing well.
In the middle group, the prominent names are Imran Khan (only from the average point of view), Fred Trueman, Michael Holding, Wasim Akram, Glenn McGrath, Shane Warne. All these bowlers were at the 75% to 90% level. Reasonable but still below par. Impressively, the values for Trueman and Holding are below 80% despite their end-stage averages being under 30.
Richard Hadlee, Andy Roberts, John Snow, Jim Laker and Malcolm Marshall are in the second half of this group, all performing at nearly their 90% stage values. Their ratios are well in excess of 90%. Of these, look at Marshall, ending with an average of 21.3 and Hadlee with 24.5.
The bowlers in the graphic above ended very well, outperforming their 90% stage values. Grimmett's finish, at the age of 44, is mind-boggling - nearly nine wickets per Test at 14.6. Barnes was even better - just under 11 wickets per Test at 10.8. He finished with 49 wickets in his last four Tests (a still-standing series record) and would have continued but for World War I.
Morne Morkel finished his career with an outstanding 150% performance level. It is a tragedy that his services were lost to South Africa when he was still doing so well. Curtly Ambrose and Joel Garner finished very well. The surprise is Kapil Dev, who everyone tend to think finished very poorly. Kapil found it hard to get wickets (as the next analysis will show) but he managed to keep his economy rate low. And his end-stage average is better than his 90%-stage average.
Kallis and Sobers had end-stage averages above 30 but find themselves in this group because of their relatively poor overall averages.
Now we move on to the next group of graphs for the bowlers - this time taking the Wickets per Test (WpT) as the base.
Imran Khan ended his career with poor bowling returns. He averaged less than a wicket per Test. However, we know that he played as a batsman in four of these nine Tests and bowled very little. McKenzie, Abdul Qadir, Prasanna and Botham averaged fewer than two wickets per Test and were performing at sub-50% levels. Kapil, in this analysis, has moved into this classification, averaging a mere two wickets per Test. This time, without a single exception, all the Indian bowlers are in the "poor" category.
Murali moves into the middle category on the WpT parameter, indicating that while he was good in terms of getting wickets, they cost him more runs toward the end. Murali's overall performance is so good that the WpT of 5 only keeps him in the middle group. Bob Willis, Richie Benaud, Laker, McGrath and Murali are in the 75% to 85% range. Ambrose, Hadlee and Marshall are in the 85% to 100% range. It can be seen that most of these bowlers took well in excess of three wickets per Test.
The most important bowler in the top category is Shane Warne, who took nearly five wickets per Test - ironically, below Murali's WpT value, but Warne is in the top category because of a lower rate of taking wickets in the first 90% of his Tests. Courtney Walsh, Jeff Thomson and Garner have all taken well over 100% of their 90%-stage values. Finally, Morkel, Barnes and Grimmett. We have already seen how these bowlers ended their careers. Barnes' last eight spells were 7 for 88, 7 for 56, 5 for 102, 3 for 26, 9 for 103, 8 for 56, 5 for 48 and 5 for 57. Grimmett finished with 6 for 73, 7 for 100, 7 for 40, 3 for 70, 5 for 56, 5 for 32, 3 for 11 and 3 for 29.
****
And now a short aside, if you will. Most of my readers will know that I am an unabashed fan of Roger Federer. But it is now clear that by end of next year, both Rafael Nadal and Novak Djokovic will have overtaken Federer's 20 Grand Slam titles - the single barometer of tennis greatness. Federer has many other unique records, but it seems almost certain that his haul of 20 will find itself in third position by the time the next generation takes over. But I find that I am now perfectly happy with Federer finishing with 20 Grand Slam titles, and in third place on this metric. I am also totally certain that to me Federer is the greatest tennis player who ever swung a racquet, and numbers like 23 and 22 will never ever change this conviction. It all comes down to the many hours of pleasure, happiness and euphoria that Federer has given me over the past decade and a half.
I make this point because a similar situation exists in Indian cricket. For many millions of fans, no one can displace Tendulkar in the pantheon of greatness even though it is almost certain that Virat Kohli will finish with a better average in all three formats and score more hundreds. But will he replace Tendulkar in the minds of many as the best Indian cricketer ever? Almost certainly not. It is clear that both Federer and Tendulkar are one-in-a-billion sportsmen and they can never be replaced. Bradman is too far removed from our times to stir such feelings. Maybe Lionel Messi could be the next such.
Email me with your comments and I will respond. This email id is to be used only for sending in comments.
Anantha Narayanan has written for ESPNcricinfo and CastrolCricket and worked with a number of companies on their cricket performance ratings-related systems