How close was the England-India series?
A look at the winning chances for the teams in the fascinating five-Test series just past
Anantha Narayanan
22-Sep-2018
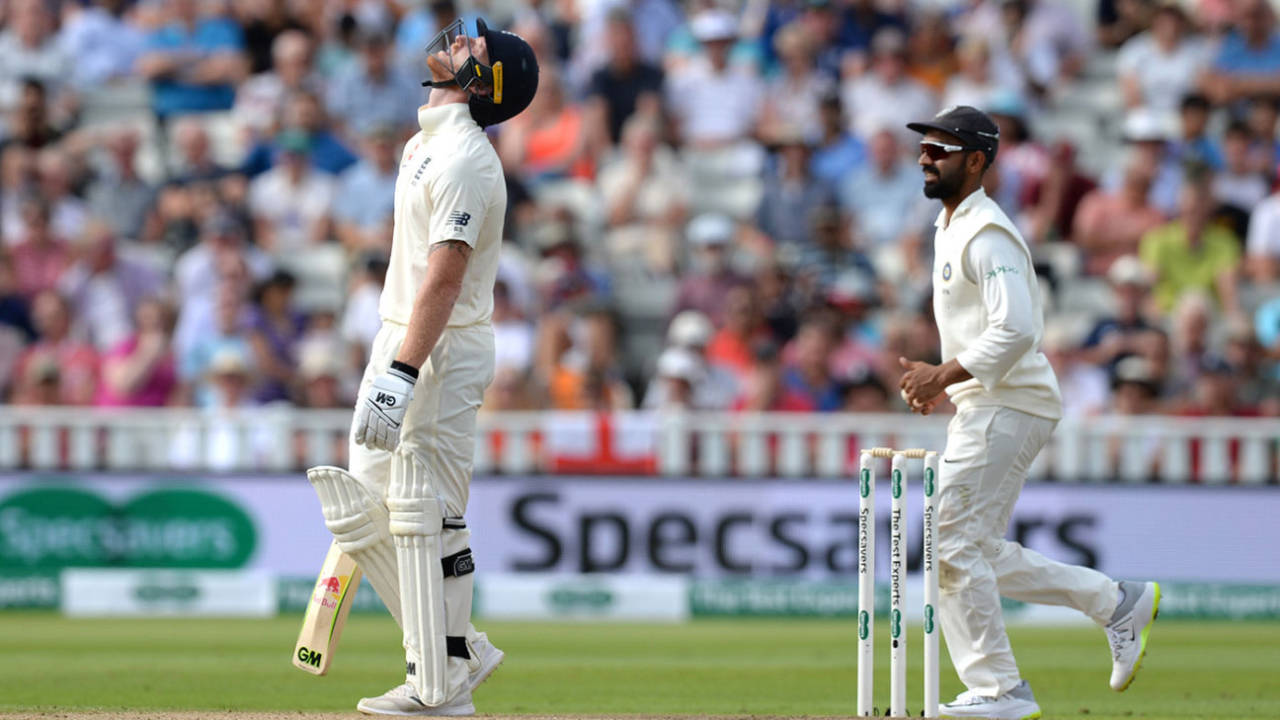
Outside of the Trent Bridge Test, which they won, India's best chance in England came at Edgbaston • Getty Images
In December last year, I wrote a piece for the Cricket Monthly on the greatest Test comebacks, in which I used a complex method to determine the winning chances of the batting team. In this article I will use that same measure, WinIndex, to look at the way the matches in the recently concluded Pataudi Trophy swung between England and India
There are two significant changes from that article, though. Back then, I restricted myself to the latter two innings. In this analysis, I will also look at the first two innings. I have to use a different methodology for this since the target scores in this segment are totally different.
The other difference is that in that feature I had used "Runs expected to be added" at the fall of each wicket, based on all the Tests played until that point. That is because that analysis covered the entire Test-playing period of 140-plus years. However, this analysis is specific only to the recent series, so I made this extracted measure using home Tests played by England (34) and away Tests played by India (28) over the past five years. The added benefit is that the projections are now team-dependent and current.
Let us look at the charts, one for each Test. Remember that the winning chances are for the team that ultimately won the match. The winning chances for the losing team is 100 minus this value. Also, the 40 points plotted run from 0/0 to xxx/9 for each innings. The last wicket to fall is plotted as 100% but not included in any computations.
Because the first two innings have no clear targets, the winning percentage values merely reflect whether the teams are on their way to achieving notional targets. In view of the fact that in this series teams won Tests whenever they went past 240 in the first innings, and considering the bowler-friendly pitches, I have set 300 as the first-innings target. The second-innings target is the first-innings score. The third and fourth innings are far more complex since the targets are clear, given we have data for two completed innings, and since there are no further batting chances. Here, the numbers are clearly the winning chances.
At the beginning of a Test, the winning chances are fixed at 50% each. This is quite fair considering that these were two evenly matched teams.
The first Test, at Edgbaston, was almost certainly the Test in which India came closest to winning one of the four matches they eventually lost. The graph above depicts this.
England's first innings of 287 was almost the par score and the first-innings chart moved either side of 50%. England finished slightly below par. During the Indian innings, the WinIndex for England moved above 50%. It was at its highest at around 57%, when India were 182 for 8. Then India recovered through a masterful innings by Virat Kohli and finished only 13 runs short. England's advantage was minimal, and that was reduced when they lost wickets regularly. It was at its lowest when England were at 87 for 7. Their chances had slipped to 19%, which means India's chances were as high as 81%. Then came the typhoon named Sam Curran. Nearly 100 runs were added and England finished at 180.
However, the target of 194 was still clearly below par and England's chances were only around 40%. As India lost wickets steadily, England's chances moved northwards. But because the target was low, the chances went above 50% only at the fall of the fifth wicket. It is interesting to note that with India at 154 for 9, England's WinIndex was only 60%. After all, the target was only 40 runs away.
The average WinIndex for England across the 40 measuring points was only 47.0. That means India had the better of the Test but could not press on to win.
The second Test, at Lord's, was completely one-sided. England's winning percentage remained at 50 only for a single Indian wicket. When India's second wicket fell at 10, England's WinIndex moved up and remained north of 50% for the rest of the Test. The loss of early wickets in England's reply brought their winning percentage down from 82. The lowest point was at the fall of the fourth wicket, at 89. At 131 for 5, their winning chance was 72%. Then Chris Woakes and Jonny Bairstow put together the match-winning partnership of 189 and England went up to 91%. In the third innings, the 91% quickly moved up to a notional maximum of 99% and stayed there.
The overall average was, not surprisingly, 80.1% for England. India were in the game for just about five minutes.
India won the third Test, at Trent Bridge, quite comfortably. However, this win was nowhere near England's dominating win at Lord's. Joe Root erred in asking India to bat and they capitalised on this. They wobbled at 82 for 3, when they fell below 50%, but recovered through Kohli's well-crafted innings, supported by Ajinkya Rahane. Towards the end, the usual collapse got them down to 53%. England's opening stand of 54 wrested away the initiative but this was soon wiped out by Hardik Pandya and the other bowlers. At the end of that disastrous second session on day two, in which England lost all ten wickets, India's WinIndex stood at 69%.
India consolidated through another hundred by Kohli, and at the end of the third innings, they were perched high at 83%. England's chase was a high-level see-saw of winning chances for India. The Ben Stokes-Jos Buttler partnership took India's WinIndex down to 71%, but the victory was sealed rather comfortably.
India's average winning chances for the match were a rather high 66.6%, indicating their strong hold over it.
On the first day in Southampton, when England were struggling at 86 for 6, their WinIndex was only around 37%. Even their good recovery to post a total of 246 did not take them to 50%. India recovered from 195 for 8 and took a handy first-innings lead. The situation at the mid-point was 47% for England.
In the third innings, England lost early wickets, and at 92 for 4 their winning chances slumped to 35%. It was India's game to win. It is interesting to note that even after a good recovery, the final target was below par and England's winning percentage at the beginning of the fourth innings was 48%.
India had a disastrous start to their chase and England's chances zoomed to 64%. Then came the partnership. I have checked and worked out that the ball before Kohli fell (123 for 3), England's winning chances were as low as 41%. Even after his dismissal, the balance was in India's favour - at 47%. The fall of the fifth wicket soon after took England's chances to just above 50%. Then each wicket after that gave them plenty of cushion and they won comfortably by 60 runs.
The average WinIndex for England was 46.9%. That means that India's winning chances across the Test were 53.1%. The main reason for this is that on the two occasions England went below 40, it took them some time to recover. The graph shows this clearly.
The fifth Test followed the first and fourth in terms of the first two innings: two totals around par and a slender lead for one team. The WinIndex for England was mostly north of 50, barring a couple of spots when they were struggling at 181 for 7 and 214 for 8. At that point, their chances slumped to 44%. At the changeover, having made a total of 332, they were slightly ahead, at 53%. India's reply followed a similar pattern. At the beginning of the third innings, England's chances remained 53%.
Here the script changed dramatically. England cut loose with the help of Alastair Cook and Root, and moved ahead to be firm favourites at the start of the fourth innings, with a WinIndex of 74%. When India lost three wickets in eight balls inside the first four overs, the barometer moved up to 88%. This came down to 74% during Rahane and KL Rahul's 118-run partnership, but went up to 79% when Hanuma Vihari was dismissed at 121 for 5.
Most unexpectedly, two young men took over, showing shades of Justin Langer and Adam Gilchrist in Hobart two decades ago. Unfortunately there was no repetition of the miracle this time. In Hobart, Langer was dismissed five runs short of the target. Here, at The Oval, Rahul left too soon. At 325 for 5, just before Adil Rashid bowled the ball of the series to Rahul (maybe Jasprit Bumrah's dismissal of Keaton Jennings in Southampton could contest this), England's WinIndex stood at 52%, too close for comfort for England. The body language of both teams confirmed it. Root captured the moment perfectly, keeping Rashid on, knowing it was England's best chance for a wicket, since the Indian batsmen had to attack. Inevitably there was a collapse, with five wickets going down for 20 runs and England romped home in a canter, winning by a 4-1 margin.
I monitored the WinIndex value as I watched the match. At 320 for 5, I estimated that if Rahul and Rishabh Pant were still there at around 360, England's WinIndex would have gone below 50. That would have been amazing, given that India had been 2 for 3 and then 121 for 5. However, I am almost certain that India would never have won. Root would have gone back to his pace trio and India could not have managed the run rate, which had exceeded five per over. It might have been a reprise of the 1979 Oval chase, but in that Test, India's late order was a doughty one. Here, the late order included Bumrah and Mohammed Shami.
The average winning chance for England was a comfortable 61.1%.
Conclusion
The bottom line is that Kohli enhanced his reputation as a great batsman but not necessarily as a captain or tactician. Root may not have batted as well as Kohli but was certainly the better leader and handled his team in a more purposeful manner.
The bottom line is that Kohli enhanced his reputation as a great batsman but not necessarily as a captain or tactician. Root may not have batted as well as Kohli but was certainly the better leader and handled his team in a more purposeful manner.
England have not solved the problems they have with Nos. 1 to 3, nor have India.
Pant is an excellent batsman but his keeping skills are still raw. How he will handle keeping on turning pitches is still to be seen.
Shikhar Dhawan has had a lot of missed opportunities. Filling boots in India should not be an option given to those who fail miserably overseas. M Vijay could be given the two upcoming home Tests against West Indies to get back his rhythm. He will be more valuable in Australia. It will be interesting to see how India approach the West Indies series: by seeking a thumping 2-0 win, or using it to prepare for the forthcoming Australian tour. Sanjay Manjrekar was right when he said that to win overseas, India need to not care too much about winning at home.
***
In March this year I wrote an article that projected where current players might end at the finish of their careers. I said that Cook had every chance of overhauling Sachin Tendulkar. However, a run of poor scores, his growing family, and a farm in Bedfordshire meant that he has called it quits at the relatively young age of 33. That decision could never have been foreseen by anyone. On the other hand, James Anderson has overtaken Glenn McGrath and is well on his way to 600-plus wickets. It will be interesting to see whether he intrudes into the spin trio ensconced safely at the top. Stuart Broad will certainly go past 500, but it is unlikely that he will go past McGrath.
Readers can comment on this article here. Note that this link takes you outside ESPNcricinfo, and ESPNcricinfo does not monitor, publish, or otherwise associate itself with comments posted there.
Incorporating feedback/improvements for the top 25 batting and bowling performances
The pieces I did over the last three months on the top batting and bowling performances in Test history have elicited plenty of feedback. Based on that and on my own ideas, I have summarised below the changes I expect to make in the Batting Performance Ratings calculations going forward. Some of these will affect the Bowling Performance Ratings work as well.
The pieces I did over the last three months on the top batting and bowling performances in Test history have elicited plenty of feedback. Based on that and on my own ideas, I have summarised below the changes I expect to make in the Batting Performance Ratings calculations going forward. Some of these will affect the Bowling Performance Ratings work as well.
1. Use Pitch Quality Index (PQI) for innings one and two, and three and four separately as against the match-PQI
This is a sensible suggestion because the average Runs per Wicket for innings three and four is more than 10% below the average RpW for innings one and two. It is also clear that run-scoring is more difficult as the match goes on. The best example is the recent Test at The Oval. The match PQI is 54.0, indicating a middling pitch slightly tilting towards the batsmen. However the PQI-1/2 is 49.5 and PQI-3/4 is 58.7, clearly indicating that the pitch improved as the match went on. This reflects the real situation. On the contrary, the numbers for the Edgbaston Test are 35.4 for the match, 43.4 for innings 1/2 and 27.3 for 3/4, indicating that batting became very difficult as the match went on. So Curran's 63 and Kohli's 51 will be valued more. Many thanks to Cool Jeeves (Giri).
This is a sensible suggestion because the average Runs per Wicket for innings three and four is more than 10% below the average RpW for innings one and two. It is also clear that run-scoring is more difficult as the match goes on. The best example is the recent Test at The Oval. The match PQI is 54.0, indicating a middling pitch slightly tilting towards the batsmen. However the PQI-1/2 is 49.5 and PQI-3/4 is 58.7, clearly indicating that the pitch improved as the match went on. This reflects the real situation. On the contrary, the numbers for the Edgbaston Test are 35.4 for the match, 43.4 for innings 1/2 and 27.3 for 3/4, indicating that batting became very difficult as the match went on. So Curran's 63 and Kohli's 51 will be valued more. Many thanks to Cool Jeeves (Giri).
2. Split the career-to-date (Ctd) away averages into Asia and Other Countries
Although Kaustav (Attitudemonger) wanted the split to be by specific country, I modified this to the above logical grouping. My thanks to him for patiently pursuing his views. You could say that he's the architect for the change. This change will have a profound impact on the computations. I have completed the all-important base work. A few examples will show how important this change is.
Although Kaustav (Attitudemonger) wanted the split to be by specific country, I modified this to the above logical grouping. My thanks to him for patiently pursuing his views. You could say that he's the architect for the change. This change will have a profound impact on the computations. I have completed the all-important base work. A few examples will show how important this change is.
Muttiah Muralitharan: 307 wickets at 27.8 away, but amazingly, 119 at 30.5 in Asia and 188 at 26.1 in other countries. An Asian bowler who performs better away from Asia.
Dale Steyn: 178 at 24.9 away, but 92 at 24.1 in Asia and 86 at 25.8 in other countries. A South African bowler with better numbers in Asia.
Brian Lara: 5736 at 47.8 away, but 1530 at 58.9 in Asia and 4206 at 44.7 in other countries. A West Indian batsman batting much better in Asia.
Saleem Malik: 2860 at 39.2 away, but 752 at 31.3 in Asia and 2108 at 43.0 in other countries. An Asian batsman does much better away from Asia.
3. Introduction of Recent Form
FrostyInstruction, and maybe one or two others, suggested this improvement. Since I already have the last-ten-Test values, it's easy to implement it. The important thing is that these ten matches are irrespective of location. As such, they will reflect true recent form. I would probably take the most recent ten Tests or one year, whichever amounts for a larger period. There were periods during the first half of Test cricket's history when players played five Tests every other year.
FrostyInstruction, and maybe one or two others, suggested this improvement. Since I already have the last-ten-Test values, it's easy to implement it. The important thing is that these ten matches are irrespective of location. As such, they will reflect true recent form. I would probably take the most recent ten Tests or one year, whichever amounts for a larger period. There were periods during the first half of Test cricket's history when players played five Tests every other year.
The weight also plays an important part. My inclination is to give Recent Form 25% weight and Ctd_Location values 75%. If there is consensus, I might be willing to go 33.3%/66.7% but not higher than that.
4. Factoring in the margin, especially for losses
I have already shared my code for the Location_TeamStrength_Result parameter. Today, a ten-run win and a 300-run win are treated similarly. I will change this to present the loss-related values in a continuous curve, and be more sensitive to the final margin, so that teams that suffer close losses get more credit. In turn, this will pass on to the players based on their contributions. However, let me warn readers that the impact of this will not be great, no more than a few points.
I have already shared my code for the Location_TeamStrength_Result parameter. Today, a ten-run win and a 300-run win are treated similarly. I will change this to present the loss-related values in a continuous curve, and be more sensitive to the final margin, so that teams that suffer close losses get more credit. In turn, this will pass on to the players based on their contributions. However, let me warn readers that the impact of this will not be great, no more than a few points.
5. A new point on the innings size
This is a new point I have presented for consideration. Take Sanath Jayasuriya's 253. Ultimately, the win margin was 201 runs and most of this innings was redundant. To a lesser extent, Graham Gooch's 153 was a few runs too many, based on the ultimate win margin of 115 runs. Compare this with Azhar Mahmood's 132, Adam Gilchrist's 144 or any other fourth-innings effort. These innings have very little or no slack. Do I incorporate this? A question for readers to ponder and comment upon. I intend doing a future article on "batsmen redundancy". Some ideas could come out of that article as well.
This is a new point I have presented for consideration. Take Sanath Jayasuriya's 253. Ultimately, the win margin was 201 runs and most of this innings was redundant. To a lesser extent, Graham Gooch's 153 was a few runs too many, based on the ultimate win margin of 115 runs. Compare this with Azhar Mahmood's 132, Adam Gilchrist's 144 or any other fourth-innings effort. These innings have very little or no slack. Do I incorporate this? A question for readers to ponder and comment upon. I intend doing a future article on "batsmen redundancy". Some ideas could come out of that article as well.
6. Tenth parameter - an X-Factor
Not a factor that will allow readers to put in their special values, but one that will allow me to define certain characteristics, derived through objective means, that permit for points to be added. These will not be based on sentiment or subjective views but factors that have been well thought out. I am somewhat vague about the process at this stage but will develop it as we move along. I will wait for readers to respond with their suggestions. They have an important role to play, provided they stay clear of subjective views and personal preferences. I will set an upper limit of 10% of the maximum (100 points) for this parameter. I expect the overall weight to be below 5%. At this stage, I can think of the following points getting in:
Not a factor that will allow readers to put in their special values, but one that will allow me to define certain characteristics, derived through objective means, that permit for points to be added. These will not be based on sentiment or subjective views but factors that have been well thought out. I am somewhat vague about the process at this stage but will develop it as we move along. I will wait for readers to respond with their suggestions. They have an important role to play, provided they stay clear of subjective views and personal preferences. I will set an upper limit of 10% of the maximum (100 points) for this parameter. I expect the overall weight to be below 5%. At this stage, I can think of the following points getting in:
- Scoring runs after a follow-on or a great deficit (only partly covered in the Innings Type).
- A great defensive innings, to save a Test (time/balls come into play - How? Still uncertain).
- Series situation. I have the means to detect 0-2 (must win), 2-2 (decider), 1-2 (draw level or widen gap) or 3-1 (dead rubber - although nothing is really dead) type of situations.
7. Making more sense of the "Runs added with late order" parameter
This is a very important measure indeed and these runs are often invaluable, leading the team to unexpected victories. I take care of the value of runs in one aspect, by using a ratio of these runs to the team score. That way, a hundred in a 200-run innings scores higher than a 200 in a 500-run innings. Then I analysed these numbers. How can the late-order runs added by a batsman in a tight fourth-innings chase (read 311 for 9 and 153 not out) or a tough third innings situation (read 356 and 149 not out) be compared to the late-order runs added in a no-pressure second-innings situation (read 526 and 248 not out). If India had been dismissed for, say, 400, they would still have won by an innings. If West Indies had been dismissed for any score below the target, they would have lost at once. So I would go deeper into this parameter, possibly devaluing the runs added in low-pressure situations.
This is a very important measure indeed and these runs are often invaluable, leading the team to unexpected victories. I take care of the value of runs in one aspect, by using a ratio of these runs to the team score. That way, a hundred in a 200-run innings scores higher than a 200 in a 500-run innings. Then I analysed these numbers. How can the late-order runs added by a batsman in a tight fourth-innings chase (read 311 for 9 and 153 not out) or a tough third innings situation (read 356 and 149 not out) be compared to the late-order runs added in a no-pressure second-innings situation (read 526 and 248 not out). If India had been dismissed for, say, 400, they would still have won by an innings. If West Indies had been dismissed for any score below the target, they would have lost at once. So I would go deeper into this parameter, possibly devaluing the runs added in low-pressure situations.
Anantha Narayanan has written for ESPNcricinfo and CastrolCricket and worked with a number of companies on their cricket performance ratings-related systems