How does one rank the top batting performances in Test cricket?
The parameters and methodology explained
Anantha Narayanan
28-Jul-2018
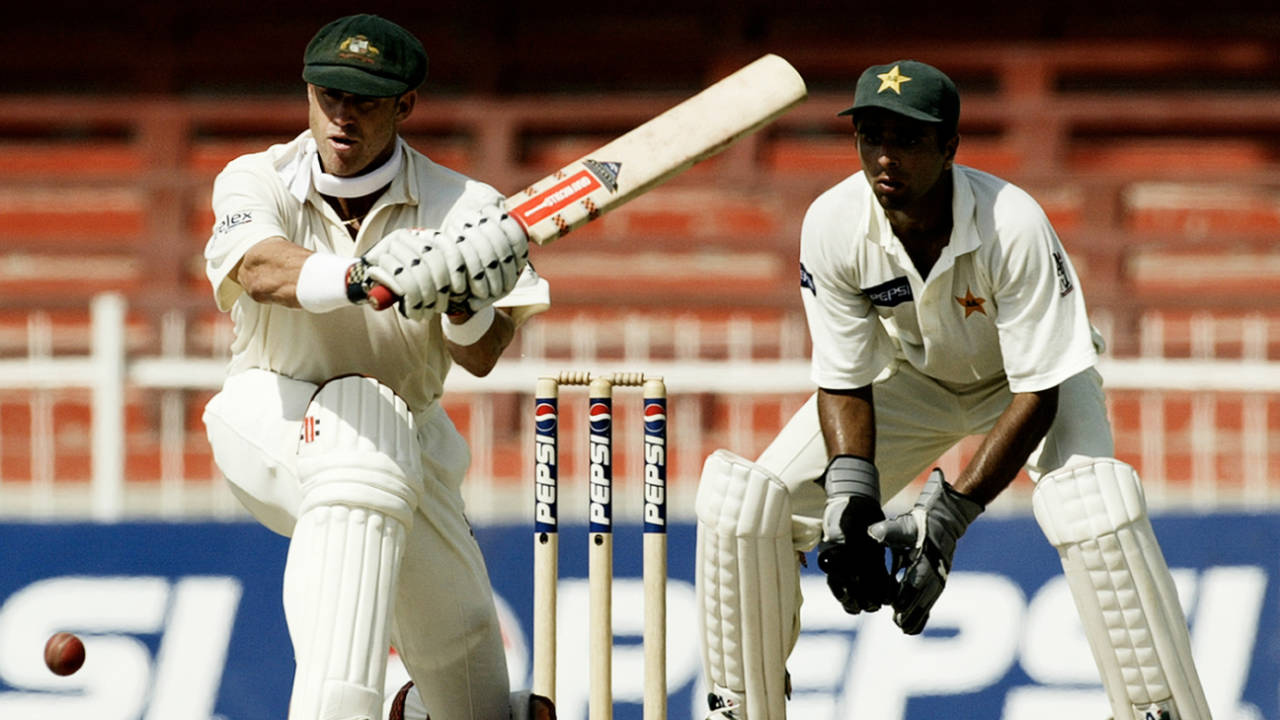
In a match in Sharjah in which Pakistan made 59 and 53, Matthew Hayden scored 119 in searingly hot conditions and led Australia to a huge innings win • Getty Images
A historical perspective
In part one of my Top Bowling Performances Analysis, I presented a complete historic perspective. Let me move on to the batting performance analysis, which I am revisiting after over 17 years.
In part one of my Top Bowling Performances Analysis, I presented a complete historic perspective. Let me move on to the batting performance analysis, which I am revisiting after over 17 years.
I have given below the basis for the creation of the Wisden 100 Batting Performances tables, the predecessor of this ranking, back in 2000.
Test Ratings for Batting - the attributes
1. Batting Base Points
2. Pitch Index
3. Bowling Quality Index
4. Percentage of Score Index
5. Point of Entry Index
6. After Point of Entry Index
7. Wickets falling while at crease Index
8. Support Index
9. Shepherding of tailenders Index
10. Highest score Index
11. Match Status Index
12. Result contribution Index
2. Pitch Index
3. Bowling Quality Index
4. Percentage of Score Index
5. Point of Entry Index
6. After Point of Entry Index
7. Wickets falling while at crease Index
8. Support Index
9. Shepherding of tailenders Index
10. Highest score Index
11. Match Status Index
12. Result contribution Index
A brief note on the calculations
When I think back, I am proud of the fact that the basis for the Wisden 100 tables is still very sound. My current base is not that much different, but as time went by, it was clear to me that there was a need to tweak some of the parameters and weights.
When I think back, I am proud of the fact that the basis for the Wisden 100 tables is still very sound. My current base is not that much different, but as time went by, it was clear to me that there was a need to tweak some of the parameters and weights.
- The Batting Base points, based on the runs scored, got just over 30% weightage, which was somewhat on the higher side; this has been rectified now.
- The "Wickets falling while at crease" and "Shepherding of tailenders" had significant overlaps.
- The interpretation of the match situation was correct only for the fourth innings. As such, the "Match Status index" needed substantial improvement.
- The "Point of Entry index" was absolute and not contextual. A score of 20 for 2 is fine while facing/chasing 100 but not if the team is facing/chasing 300.
- The "After Point of Entry index" was lightweight. It didn't really mean a lot.
- The database was in the initial stages and quite raw, without the refinements listed later in the article.
Now let me present the top 20 entries in the original Wisden 100 table for batting performances.
| Batsman | Rtgpts | Runs | Year | For | Vs | Inns | Result |
| Don Bradman | 262.4 | 270* | 1937 | Aus | Eng | 3 | Won |
| Brian Lara | 255.2 | 153* | 1999 | Win | Aus | 4 | Won |
| Graham Gooch | 252.0 | 154* | 1991 | Eng | Win | 3 | Won |
| Ian Botham | 240.8 | 149* | 1981 | Eng | Aus | 3 | Won |
| Don Bradman | 236.8 | 299* | 1932 | Aus | Saf | 2 | Won |
| VVS Laxman | 234.8 | 281 | 2001 | Ind | Aus | 3 | Won |
| Clem Hill | 234.2 | 188 | 1898 | Aus | Eng | 1 | Won |
| Azhar Mahmood | 232.6 | 132 | 1998 | Pak | Saf | 1 | Won |
| Kim Hughes | 229.7 | 100* | 1981 | Aus | Win | 1 | Won |
| Brian Lara | 228.1 | 375 | 1994 | Win | Eng | 1 | Drawn |
| Tip Foster | 226.7 | 287 | 1903 | Eng | Aus | 2 | Won |
| Clyde Walcott | 223.0 | 220 | 1954 | Win | Eng | 1 | Won |
| Mark Taylor | 221.4 | 144 | 1991 | Aus | Win | 3 | Won |
| Brian Lara | 221.3 | 213 | 1999 | Win | Aus | 2 | Won |
| Dean Jones | 220.9 | 184* | 1987 | Aus | Eng | 1 | Won |
| Saleem Malik | 219.9 | 237 | 1994 | Pak | Aus | 3 | Drawn |
| Pelham Warner | 218.4 | 132* | 1899 | Eng | Saf | 3 | Won |
| Reg Simpson | 218.4 | 156* | 1951 | Eng | Aus | 2 | Won |
| Hanif Mohammad | 217.3 | 337 | 1958 | Pak | Win | 3 | Drawn |
| John Edrich | 217.1 | 310* | 1965 | Eng | Nzl | 1 | Won |
Database enhancements
I went in depth into the area of improvements in the database in part one of the article on bowling performance analysis. These can be read here. I will only provide the summary now.
I went in depth into the area of improvements in the database in part one of the article on bowling performance analysis. These can be read here. I will only provide the summary now.
1. Career-Location-to-date (CLtD) batting and bowling averages at the level of each Test.
2. Pitch Quality Index (PQI)
3. Weighted Bowling Quality for the innings
4. Batting quality based on the CLtD Batting averages
5. Identification of nightwatchman innings
6. Wicket-value (WkV) determination
7. Runs per Weighted Innings (RpWI)
8. Enunciation of "neutral" location
9. Contribution analysis
The current basis for analysis
Now for the current parameters and a brief explanation of the same. The first bit of relevant information is that the Batting Performance Ratings will be on a scale of 1000, as is the current practice. The 1000 mark is virtually unreachable: maybe a batsman from Afghanistan scoring, say, 180 not out against Australia at the MCG, in a successful chase, with a score of 300 for 9, recovering from 120 for 8, in a match in which the 300 is by far the biggest total, and against a bowling quartet of, say, Mitchell Starc, Josh Hazlewood, Pat Cummins and Nathan Lyon.
Now for the current parameters and a brief explanation of the same. The first bit of relevant information is that the Batting Performance Ratings will be on a scale of 1000, as is the current practice. The 1000 mark is virtually unreachable: maybe a batsman from Afghanistan scoring, say, 180 not out against Australia at the MCG, in a successful chase, with a score of 300 for 9, recovering from 120 for 8, in a match in which the 300 is by far the biggest total, and against a bowling quartet of, say, Mitchell Starc, Josh Hazlewood, Pat Cummins and Nathan Lyon.
It is necessary to briefly compare the bowling and batting analyses. The number of bowler spells analysed was 44,652. This means, on average, just over 19 bowling spells per Test match. The average rating points for each of these bowling performances is 158.3. Contrast this with the batting scene. The number of innings analysed is 81,839. This means on average just over 35 individual innings in a Test match. The average rating points for these batting performances is 99.5.
This means that, notwithstanding the effort to match the top batting and bowling performances, the average batting performance has a lower value. The difference in numbers is stark: 105 bowling performances clock in at over 700, and 522 are over 600. Contrast this with 61 batting performances over 700 and 287 over 600.
The highest values for each measure, which are highlighted, are extracted from the 3233 performances that received in excess of 400 rating points. For validation purposes, the average across these 3233 performances is used. An average across all 81,800-plus innings will not make any sense and will distort the overall picture. A fifty made in a successful chase of 70 would contain too many undeserved outliers.
1. Base points (Runs scored)
The batting base points are given for runs scored. While determining the bowling base points, a gradually increasing scale was used. That is not done here since a very high individual score does not necessarily lead to a win. Of the 30 triple-centuries scored, only 12 (40%) have led to wins. Out of the 18 nine-wicket hauls, 15 (83.3%) have led to wins. Hence the points are allotted in a linear manner.
The batting base points are given for runs scored. While determining the bowling base points, a gradually increasing scale was used. That is not done here since a very high individual score does not necessarily lead to a win. Of the 30 triple-centuries scored, only 12 (40%) have led to wins. Out of the 18 nine-wicket hauls, 15 (83.3%) have led to wins. Hence the points are allotted in a linear manner.
Brian Lara's unbeaten 400 in Antigua in the drawn Test against England gets the highest points in this measure.
2. HSI value (Support received)br<>
The High Score Index is a parametrisation of the support factor. I will describe this briefly. The player's HSI is determined by dividing the player's own score by the next highest score and adjusting this factor by the share of team runs. The final HSI value is a clear indicator of the support scenario.
In the first ever Test, Charles Bannerman's unbeaten 165 out of a team batsman total of 237, coupled with a next best score of 18, gets him the highest ever HSI of 6.38. This fetches him the top placing in this category.
3. IPV (Own score compared to scores of team-mates)
The IPV (Innings Peer Value) compares a player's score with the average individual score of the other batsmen in the two team innings. It is a clear indication of the value of the player's contribution to the team. This works in conjunction with the HSI in that it takes care of the situations where measuring the support factor is not enough. In general, there is a correlation between the two parameters.
The IPV (Innings Peer Value) compares a player's score with the average individual score of the other batsmen in the two team innings. It is a clear indication of the value of the player's contribution to the team. This works in conjunction with the HSI in that it takes care of the situations where measuring the support factor is not enough. In general, there is a correlation between the two parameters.
Against England in Cape Town in 1899, South Africa's Jimmy Sinclair scored 106 out of the team total of 177. In the second innings, South Africa were bowled out for 35. The average for the 21 South African innings - other than Sinclair's 106 - works out to 4.52 and Sinclair's IPV is the highest ever at 23.43.
4. Runs added with late order
This important parameter gives credit to batsmen who shepherd the lower order and add valuable runs. Often these runs are gold and mean the difference between an unexpected win and a defeat.
This important parameter gives credit to batsmen who shepherd the lower order and add valuable runs. Often these runs are gold and mean the difference between an unexpected win and a defeat.
In Port Elizabeth in 1992, Kapil Dev came in at 31 for 6 and added 184 for the last four wickets. He scored 129. His innings receives the maximum points in this category.
5. Pitch Quality
The match PQI is used for this calculation. This is a normalised value dealing with extremes like the Delhi Test of 1955 - a batsman's paradise supreme, when 1093 runs were scored for ten wickets - at one end, and the MCG Test of 1932 - 234 runs for 29 wickets - at the other. It is normalised to a 100-based value, with proportionate calculations on either side of the median. On this basis, the extreme values are 82 (the 1955 Delhi Test) and 14 (the 1932 MCG Test). A fifty in a match with a PQI of 25 would be far more valuable than a 150 in a match with PQI of 75.
The match PQI is used for this calculation. This is a normalised value dealing with extremes like the Delhi Test of 1955 - a batsman's paradise supreme, when 1093 runs were scored for ten wickets - at one end, and the MCG Test of 1932 - 234 runs for 29 wickets - at the other. It is normalised to a 100-based value, with proportionate calculations on either side of the median. On this basis, the extreme values are 82 (the 1955 Delhi Test) and 14 (the 1932 MCG Test). A fifty in a match with a PQI of 25 would be far more valuable than a 150 in a match with PQI of 75.
In Sharjah in 2002, Pakistan compiled a total of 112 in their two innings. It was not an unplayable pitch, as proved by Australia's total of 310. Embedded in this team effort was a magnificent 119 by Mathew Hayden. The PQI was only 23.2, confirming that the wicket was indeed very difficult to bat on. The innings fetches Hayden the highest points allocation in this category.
6. Overall bowling quality
How good the opposing bowlers were is an important factor when evaluating batsmen's performances. Scoring runs is one thing, but scoring runs when a quartet of top-class bowlers are relentlessly at you is a different matter. In this context, a century against the West Indian attack of the 1980s should be valued much higher than a 300 against very average bowling. The bowling quality for the innings is used for this. It is determined using the CLtD (Career-Location-to-Date) values of the bowlers who bowled in the innings. The basis is a weighted harmonic mean of the CLtD averages, thus ensuring that one weak bowler does not dilute the efforts of the other, stronger, bowlers.
How good the opposing bowlers were is an important factor when evaluating batsmen's performances. Scoring runs is one thing, but scoring runs when a quartet of top-class bowlers are relentlessly at you is a different matter. In this context, a century against the West Indian attack of the 1980s should be valued much higher than a 300 against very average bowling. The bowling quality for the innings is used for this. It is determined using the CLtD (Career-Location-to-Date) values of the bowlers who bowled in the innings. The basis is a weighted harmonic mean of the CLtD averages, thus ensuring that one weak bowler does not dilute the efforts of the other, stronger, bowlers.
Against Australia in Adelaide in 1951, Len Hutton carried his bat for an outstanding 156. The bowling was spearheaded by Ray Lindwall, Keith Miller, Bill Johnston, Ian Johnson and Jack Iverson. Hutton's innings gets the highest credit in this category.
A couple of innings such as John Lyons' 134 and Allan Steel's 148 before the turn of the century have higher values, but the bowling values for those innings are completely off the radar. The attacks included bowlers with the following career-to-date location-specific bowling averages at the start of those Tests: Frederick Spofforth (9.20), Johnny Briggs (9.26), and George Lohmann (10.44).
Virat Kohli's Wanderers classic of 119 and Kim Hughes' MCG masterclass of 100 not out rank quite high.
7. Innings target and status
This is inarguably the most complex of calculations, and the one that has changed the most. Each innings has to be handled carefully. This is the one factor that has enabled me to give due recognition to performances across a match. All the innings situations have been summarised below. In short, I determine a target for each innings. The target is a notional one for the first three innings and the actual one for the fourth innings. I determine the status of the innings at the point of a batsman's entry, by a combination of the task ahead (target to actual scores), and the resources at hand (based on which wicket has just fallen). Then I allot the rating points.
This is inarguably the most complex of calculations, and the one that has changed the most. Each innings has to be handled carefully. This is the one factor that has enabled me to give due recognition to performances across a match. All the innings situations have been summarised below. In short, I determine a target for each innings. The target is a notional one for the first three innings and the actual one for the fourth innings. I determine the status of the innings at the point of a batsman's entry, by a combination of the task ahead (target to actual scores), and the resources at hand (based on which wicket has just fallen). Then I allot the rating points.
- The first innings is the easiest. The notional target is 300 for all Tests until 1899, 350 for all Tests until 1920, and 400 for all Tests afterwards. The idea is that no team would start a Test aiming for either 200 or 600.
- The second innings is a little more complicated. In a current Test match, if the first batting team has been dismissed for a low score, say 124, the target would be 324, sufficient to achieve a lead of 200. If the first batting team has been dismissed for a middling score, say 255, the target would be to reach a total of 400. If the first batting team has been dismissed for a high score, say 465, the target would be to reach a total of 400. The objective is to be realistic. In any case, the second-innings target is limited by the first-innings target.
- The third innings is the toughest of all. The situation has to be assessed accurately and a target worked out. This has to be done realistically. First, I look at innings in which the batting team has a deficit, either through a follow-on or otherwise. Depending on the deficit, the target for the innings will vary. If the deficits are 250-plus, 200-249, 150-199, 100-149 and sub-100, the targets will be the runs required to set fourth-innings targets of 150, 175, 200, 250 and 300 respectively. Next, I will look at innings in which the batting team has a lead. Depending on the lead, the target for the innings will vary. If the lead is below 150, the target will be the lead plus 250. If the lead is greater than 150, the target will be the runs required to set a fourth-innings target of 400. Finally, the target is set to a minimum of 100. Quite complicated, no doubt, but totally understandable and based on common sense.
- The fourth innings is straightforward. The target is set in stone and ranges from 1 to 836.
The innings-type value was the highest for Kamran Akmal against India in the Karachi Test of 2006. The notional first-innings target was 400. Akmal came in at 39 for 6 and took Pakistan to a respectable score of 245. If one ignores the monster third innings of 599, this was not an easy batting pitch.
8. Innings performance
While the previous parameter works on the innings status at a batsman's entry, this parameter determines to what extent the team has achieved its task, and rewards the team and the batsmen. The first three innings, in which the targets can be exceeded comfortably, are adjusted to be at par with the fourth innings, in which the target can only be reached.
While the previous parameter works on the innings status at a batsman's entry, this parameter determines to what extent the team has achieved its task, and rewards the team and the batsmen. The first three innings, in which the targets can be exceeded comfortably, are adjusted to be at par with the fourth innings, in which the target can only be reached.
I have taken care to exclude instances like Hutton scoring an unbeaten 98 in a successful chase of 142 for 1. At Lord's in 1984, West Indies had a tough target of 341 and Gordon Greenidge masterminded the chase with a majestic innings of 214 not out. His innings gets the highest points in this measure.
9. Contribution to match result
I am not a great proponent of the American axiom of "winning is everything", but I feel strongly that winning is something. Winning a Test is important, and the ratings process must give due credit to the batting performances that were primarily responsible for wins, as against the ones that led to draws or losses.
I am not a great proponent of the American axiom of "winning is everything", but I feel strongly that winning is something. Winning a Test is important, and the ratings process must give due credit to the batting performances that were primarily responsible for wins, as against the ones that led to draws or losses.
This is a direct link to the result, the location and the relative team strengths. There are three locations (Home, Neutral and Away), three results (Win, Draw and Loss) and three team-strength situations (Strong, Comparable and Weak). The team is allotted a certain number of points based on these three parameters. The rating will be highest for an away win by a weak team against a strong team and lowest for a home loss for a strong team against a weak team.
The team points are then allocated to the batsmen based on their contribution to the result. The complex match contribution values are used to do this. Hence, there has to be a combination of a magnificent batting performance and an outstanding result (away win against a much stronger team) to get high points in this measure. As has already been seen, the contribution is worked on a non-contextual basis. The first eight parameters are contextual.
Bruce Mitchell got the maximum points in this regard for his unbeaten 164 at Lord's in 1935. South Africa had a small lead of 30 over England in the first innings. Mitchell remained not out on 164 and took South Africa to a match-winning total of 278. It can be seen that this recognition is for a combination of a magnificent innings and an equally wonderful away win over a very strong team.
A general view on the Batsmen Performance Ratings
The analysis covers all Tests till the second one between Sri Lanka and South Africa in Colombo in 2018. It is likely that part two might include the first two England-India Tests as well.
The analysis covers all Tests till the second one between Sri Lanka and South Africa in Colombo in 2018. It is likely that part two might include the first two England-India Tests as well.
As has already been explained, the ratings work is done by allotting points for nine measures. The overall weight ranges from around 4% to 20%. The individual performance weights could have a wider range. For a performance to be in the top ten or so, it cannot score quite low on even one measure. For a performance to be in the top 50 or so, it could sustain one or possibly even two sub-par measures. For a performance to be in the top 200, maybe two or three sub-par measures could be permissible. And so on.
What anyone perceives as a top batting performance, making their top ten, could be found lacking in some attribute or the other from the list above. Perhaps the pitch was a very good batting one, or the bowlers were, at best, average; perhaps it was a home game, there was no pressure on the team (and the batsmen); the match might not have been won, and so on.
The bottom line is that it is extremely tough to do a good guess. This problem is compounded because our knowledge is limited. Even if we have encyclopaedic knowledge, we are influenced by the fact that some matches we watched live and read about, and others we might have only read about.
Take Azhar Mahmood's 132 at Kingsmead against South Africa. When one thinks of great batting performances, this stays under the radar. But it is, almost inarguably, one of the truly great modern batting performances, with almost no negative points. The same could be said about Clem Hill's 188 or Graham Gooch's unbeaten 154. That is where computer-based analysis is superior; it has no heart to contend with and works with no limits or limitations and no bias.
In view of the importance of the allocated weights, I am sure readers could rightfully ask me, "How do you know you have got the correct weights?" The answer is that it is a combination of common sense, knowing what to look for, looking for out-of-place performances, and checking the overall summaries. My gut feel says what to expect in the overall percentage values. If the "Base Runs value" exceeds 20%, I would be concerned. If the HSI, IPV or "Runs with late order" exceed 5%, I would not be happy. If "Contribution to match result" is below 10% or above 15%, I would start worrying. If one performance is an undeserved total outlier, I would not sleep peacefully.
The basis for analysis might seem to be arbitrary. That is possibly true. However, many months of work have gone into the numbers to ensure that these do not carry too much or too little weight. The results of the analysis are also not one person's views. There has been a lot of consultation to ensure that there is consensus. I must have spent an hour on each of the top 30 performances, going over each of the nine values and evaluating it with the overall values. In addition, I also check a few selected random performances every time the list is prepared.
The final answer is that this compilation is the result of hard work over hundreds of days. There is no easy tool to do the checking. That is one reason why I get upset when some readers throw inane, superficial and silly questions after a five-minute read of complex articles. Since I have spent nearly a thousand hours working on the analysis, I request that readers should at least spend that many seconds reading it.
A preview of part two
I have presented below three charts as a preview of part two of the analysis. This will give an idea of the way the analyses have been done. But I must also confess that part two will become too long unless I move something to this article.
I have presented below three charts as a preview of part two of the analysis. This will give an idea of the way the analyses have been done. But I must also confess that part two will become too long unless I move something to this article.
First is a summary of the weights secured by the nine parameters.
I am happy at the weights, which have been summarised across the 3233 qualifying performances. The four parameters that get more than 10% weight each are probably the most important and get their deserved places. Of course, it should be understood that the weights for individual performances will be quite different. A third-innings effort where the team is way behind will have a high "Innings Status" parameter value. Any batsmen who batted against the great bowling line-ups of West Indies during the 1980s or Australia either side of the turn of the millennium will have high "Overall Bowling Quality" values. Batsmen who performed well on difficult pitches with PQI lower than 35, will have high "Pitch Quality" values. And so on.
Next is a grouping of the 3233 batting performances, by period.
Since the number of Tests played in different periods varies from 134 during the 1876-1914 period to 833 in 2000-2018, I had to adopt an alternate measure to compare. I worked out the frequency of top batting performances per Test across the periods. During the first period, this was the lowest at 1.10 performances per Test. This is understandable, given the difficulties in batting on uncovered wickets, and the fact that Tests were played over three days. Then there was an increase to 1.20 during the period 1920-1939.
The third era, 1946-1959, saw the bowlers hold sway, with 1.20 top batting performances per Test. The next period, 1960-1979, saw a lot of defensive but prolific batting, and this is indicated by the move up to 1.41 performances per Test. The next period saw a slight drop to 1.38 performances per Test. Recently batting levels have improved significantly and we have 1.53 performances per Test in the 2000-2018 period. The overall average during the 2313 Tests played so far is 1.40.
Now let us look at a pie-chart of the top batting performances, by innings.
First let us get some basic information. In the 2313 Tests played so far, there have been 2313 first innings, 2294 second innings, 2233 third innings and 1550 fourth innings. This explains why only 9.1% of the performances are in the fourth innings. In terms of frequency, the first innings is the best, with 36.0%; followed by the second innings, with 32.5%; the third innings, with 22.4%; and finally the fourth innings. The last one is understandable since many fourth innings are inconsequential, or present no chance of a win for either team. Also, many fourth-innings targets are small to middling and do not warrant outstanding performances.
Do come in - It is your turn
As I have already indicated, both the "Wisden" and "100" have been retired from descriptions of these rankings. The Wisden 100 was a masterstroke and indicated the breadth of coverage. I acknowledge Wisden Online's pioneering initiative, and am proud of having been the master chef. As a logical follow-up to Red Cherry 25, I have named this list the Golden Willow 25.
As I have already indicated, both the "Wisden" and "100" have been retired from descriptions of these rankings. The Wisden 100 was a masterstroke and indicated the breadth of coverage. I acknowledge Wisden Online's pioneering initiative, and am proud of having been the master chef. As a logical follow-up to Red Cherry 25, I have named this list the Golden Willow 25.
Any references to performances outside the list of 25 will be without any revelation of their actual position or rating points. I will only indicate a broad range. This will avoid any unnecessary comments and back and forth.
Readers can comment on this article here. Note that this link takes you outside ESPNcricinfo, and ESPNcricinfo does not monitor, publish, or otherwise associate itself with comments posted there.
Anantha Narayanan has written for ESPNcricinfo and CastrolCricket and worked with a number of companies on their cricket performance ratings-related systems